
- Start >
- Rivers >
- Discharge >
- Untere Donau >
- Kothmaißling >
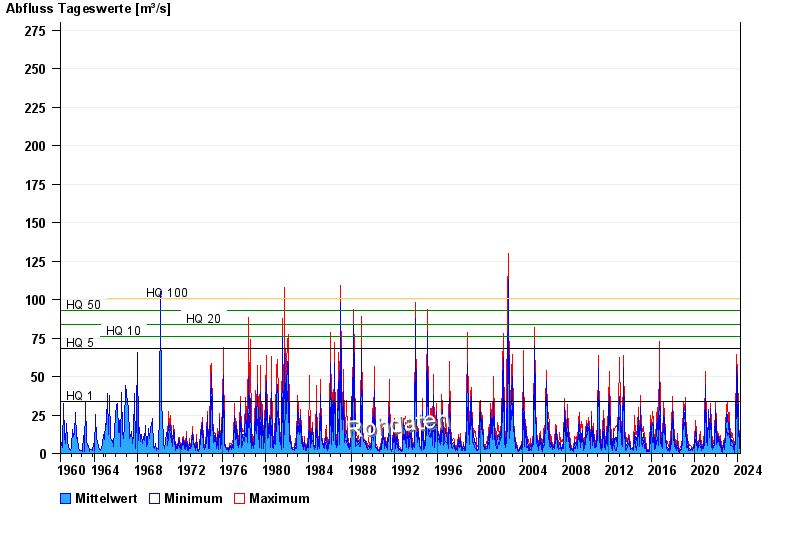
- Chart of total period

Chart of total period Kothmaißling / Chamb
Discharge from 01.11.1960 to 26.04.2024
note
Beeinflussung durch Buhneneinbau unterhalb vom Pegel
- HQ1 34 m³/s
- HQ5 68 m³/s
- HQ10 76 m³/s
- HQ20 84 m³/s
- HQ50 93 m³/s
- HQ100 101 m³/s
| Date | Mean value [m³/s] | Maximum [m³/s] | Minimum [m³/s] |
|---|---|---|---|
| 26.04.2024 | 3.72 | 4.16 | 3.24 |
| 25.04.2024 | 4.09 | 4.74 | 3.41 |
| 24.04.2024 | 4.34 | 5.14 | 3.79 |
| 23.04.2024 | 5.08 | 6.36 | 4.16 |
| 22.04.2024 | 8.85 | 11.9 | 6.36 |
| 21.04.2024 | 10.5 | 13 | 7.83 |
| 20.04.2024 | 18 | 19.9 | 12.5 |
© Bayerisches Landesamt für Umwelt 2024