
- Start >
- Rivers >
- Discharge >
- Untere Donau >
- Kollbach >
- Chart of year

Chart of year Kollbach / Kollbach
Discharge from 22.09.2022 to 21.09.2023
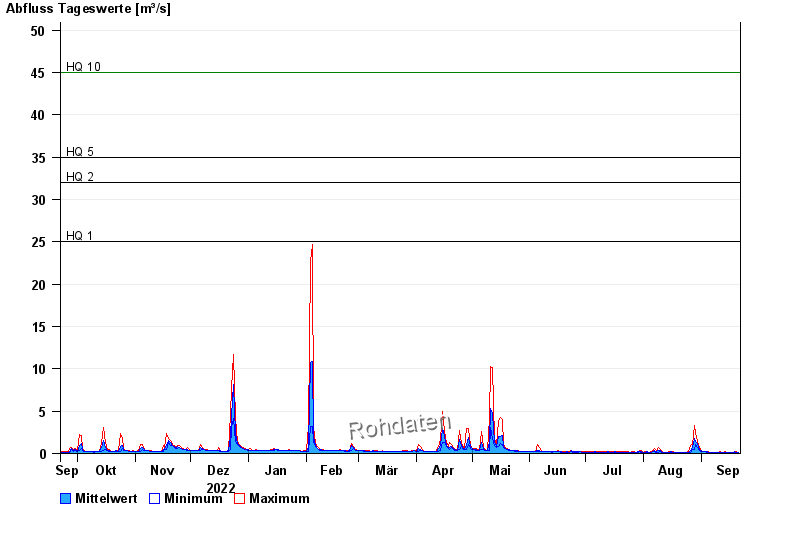
- HQ1 25 m³/s
- HQ2 32 m³/s
- HQ5 35 m³/s
- HQ10 45 m³/s
- HQ20 57 m³/s
- HQ50 72 m³/s
- HQ100 90 m³/s
| Date | Mean value [m³/s] | Maximum [m³/s] | Minimum [m³/s] |
|---|---|---|---|
| 21.09.2023 | 0.153 | 0.164 | 0.147 |
| 20.09.2023 | 0.155 | 0.182 | 0.147 |
| 19.09.2023 | 0.2 | 0.271 | 0.164 |
| 18.09.2023 | 0.147 | 0.164 | 0.11 |
| 17.09.2023 | 0.146 | 0.164 | 0.133 |
| 16.09.2023 | 0.151 | 0.164 | 0.133 |
| 15.09.2023 | 0.147 | 0.164 | 0.133 |
© Bayerisches Landesamt für Umwelt 2024