
- Start >
- Rivers >
- Discharge >
- Untere Donau >
- Kollbach >
- Chart of year

Chart of year Kollbach / Kollbach
Discharge from 22.09.2021 to 21.09.2022
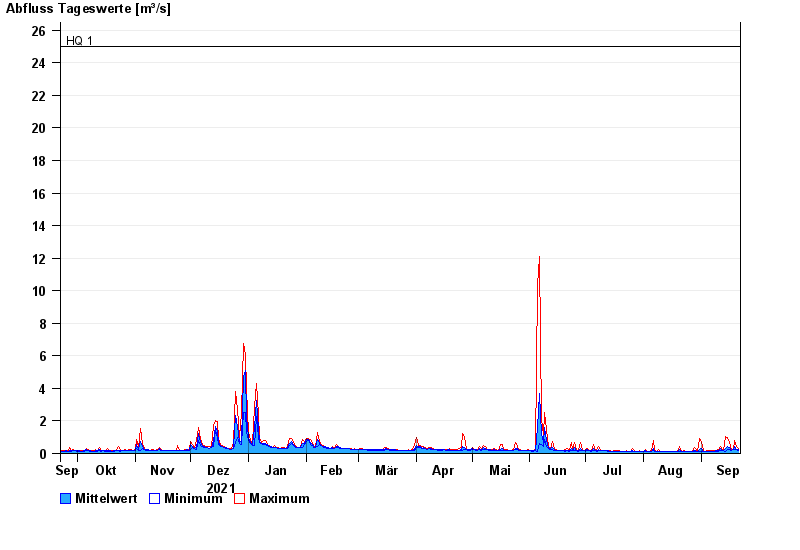
- HQ1 25 m³/s
- HQ2 32 m³/s
- HQ5 35 m³/s
- HQ10 45 m³/s
- HQ20 57 m³/s
- HQ50 72 m³/s
- HQ100 90 m³/s
| Date | Mean value [m³/s] | Maximum [m³/s] | Minimum [m³/s] |
|---|---|---|---|
| 21.09.2022 | 0.222 | 0.293 | 0.18 |
| 20.09.2022 | 0.253 | 0.446 | 0.22 |
| 19.09.2022 | 0.425 | 0.792 | 0.219 |
| 18.09.2022 | 0.219 | 0.241 | 0.218 |
| 17.09.2022 | 0.202 | 0.218 | 0.177 |
| 16.09.2022 | 0.345 | 0.664 | 0.218 |
| 15.09.2022 | 0.437 | 1 | 0.263 |
© Bayerisches Landesamt für Umwelt 2024