
- Start >
- Rivers >
- Discharge >
- Untere Donau >
- Kollbach >
- Chart of year

Chart of year Kollbach / Kollbach
Discharge from 22.09.2020 to 21.09.2021
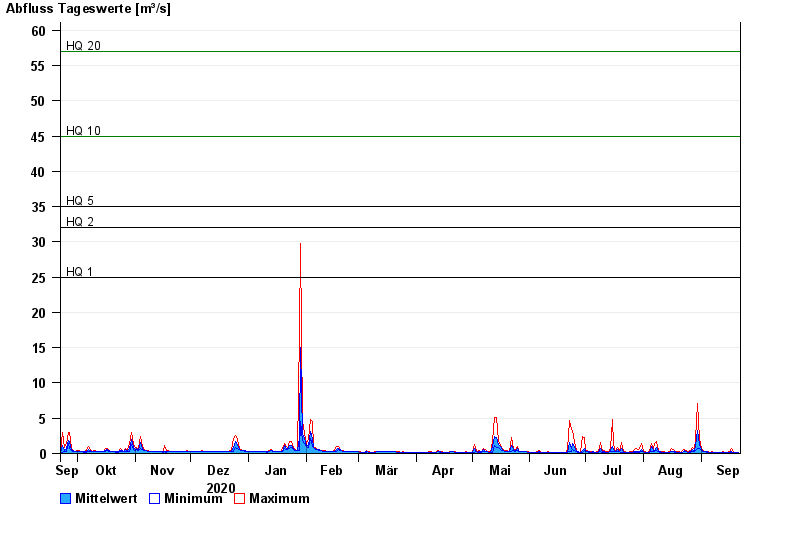
- HQ1 25 m³/s
- HQ2 32 m³/s
- HQ5 35 m³/s
- HQ10 45 m³/s
- HQ20 57 m³/s
- HQ50 72 m³/s
- HQ100 90 m³/s
| Date | Mean value [m³/s] | Maximum [m³/s] | Minimum [m³/s] |
|---|---|---|---|
| 21.09.2021 | 0.152 | 0.174 | 0.141 |
| 20.09.2021 | 0.16 | 0.192 | 0.141 |
| 19.09.2021 | 0.162 | 0.192 | 0.141 |
| 18.09.2021 | 0.169 | 0.192 | 0.156 |
| 17.09.2021 | 0.286 | 0.732 | 0.174 |
| 16.09.2021 | 0.178 | 0.258 | 0.156 |
| 15.09.2021 | 0.146 | 0.156 | 0.127 |
© Bayerisches Landesamt für Umwelt 2024