
- Start >
- Rivers >
- Discharge >
- Untere Donau >
- Kollbach >
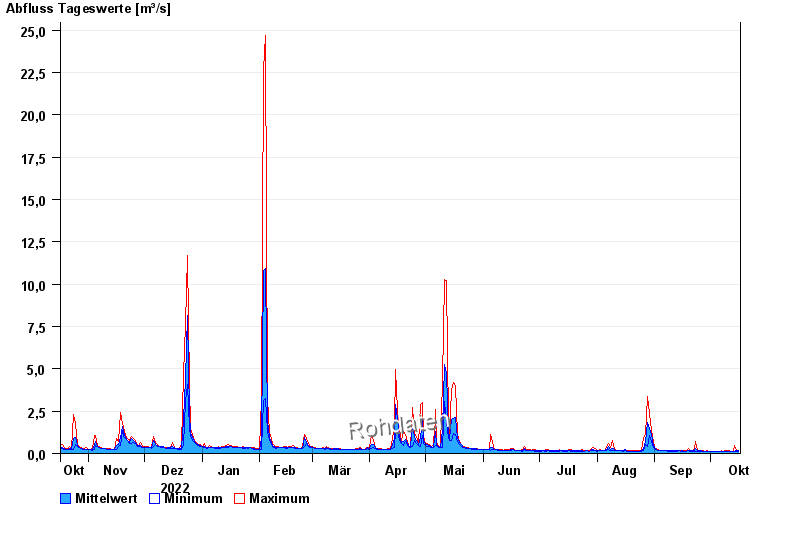
- Chart of year

Chart of year Kollbach / Kollbach
Discharge from 17.10.2022 to 16.10.2023
| Date | Mean value [m³/s] | Maximum [m³/s] | Minimum [m³/s] |
|---|---|---|---|
| 16.10.2023 | 0.155 | 0.164 | 0.147 |
| 15.10.2023 | 0.17 | 0.202 | 0.12 |
| 14.10.2023 | 0.145 | 0.452 | 0.12 |
| 13.10.2023 | 0.136 | 0.147 | 0.12 |
| 12.10.2023 | 0.136 | 0.147 | 0.133 |
| 11.10.2023 | 0.143 | 0.182 | 0.133 |
| 10.10.2023 | 0.142 | 0.164 | 0.133 |
© Bayerisches Landesamt für Umwelt 2024