
- Start >
- Rivers >
- Discharge >
- Untere Donau >
- Kollbach >
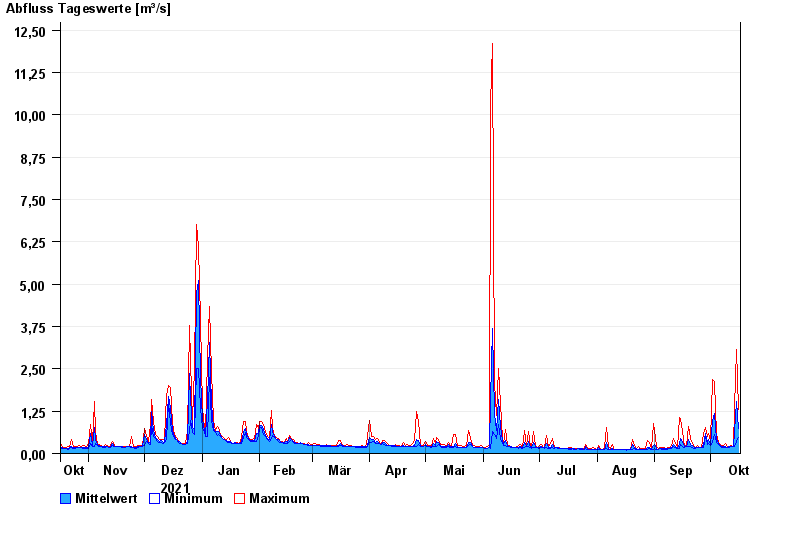
- Chart of year

Chart of year Kollbach / Kollbach
Discharge from 17.10.2021 to 16.10.2022
| Date | Mean value [m³/s] | Maximum [m³/s] | Minimum [m³/s] |
|---|---|---|---|
| 16.10.2022 | 0.749 | 1.3 | 0.475 |
| 15.10.2022 | 1.53 | 3.08 | 0.343 |
| 14.10.2022 | 0.651 | 1.35 | 0.193 |
| 13.10.2022 | 0.194 | 0.213 | 0.192 |
| 12.10.2022 | 0.206 | 0.235 | 0.192 |
| 11.10.2022 | 0.194 | 0.213 | 0.191 |
| 10.10.2022 | 0.187 | 0.212 | 0.171 |
© Bayerisches Landesamt für Umwelt 2024