
- Start >
- Rivers >
- Discharge >
- Untere Donau >
- Kollbach >
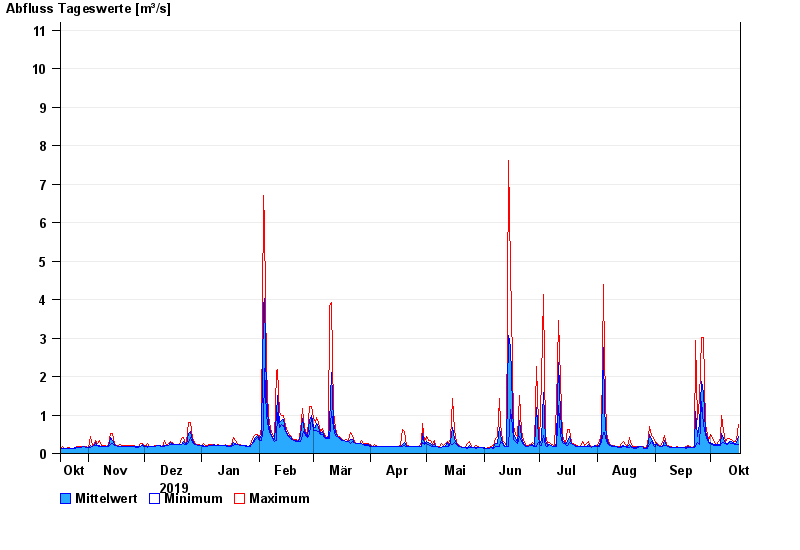
- Chart of year

Chart of year Kollbach / Kollbach
Discharge from 17.10.2019 to 16.10.2020
- 10.06.1965 Abfluss: 49 m³/s
- 22.06.1965 Abfluss: 48,1 m³/s
- 01.06.1965 Abfluss: 45,9 m³/s
- 02.06.1995 Abfluss: 45,5 m³/s
- 15.02.1990 Abfluss: 44,4 m³/s
| Date | Mean value [m³/s] | Maximum [m³/s] | Minimum [m³/s] |
|---|---|---|---|
| 16.10.2020 | 0.442 | 0.76 | 0.244 |
| 15.10.2020 | 0.288 | 0.351 | 0.244 |
| 14.10.2020 | 0.264 | 0.322 | 0.243 |
| 13.10.2020 | 0.281 | 0.322 | 0.268 |
| 12.10.2020 | 0.31 | 0.351 | 0.268 |
| 11.10.2020 | 0.32 | 0.381 | 0.294 |
| 10.10.2020 | 0.259 | 0.381 | 0.243 |
© Bayerisches Landesamt für Umwelt 2024