
- Start >
- Rivers >
- Discharge >
- Untere Donau >
- Kollbach >
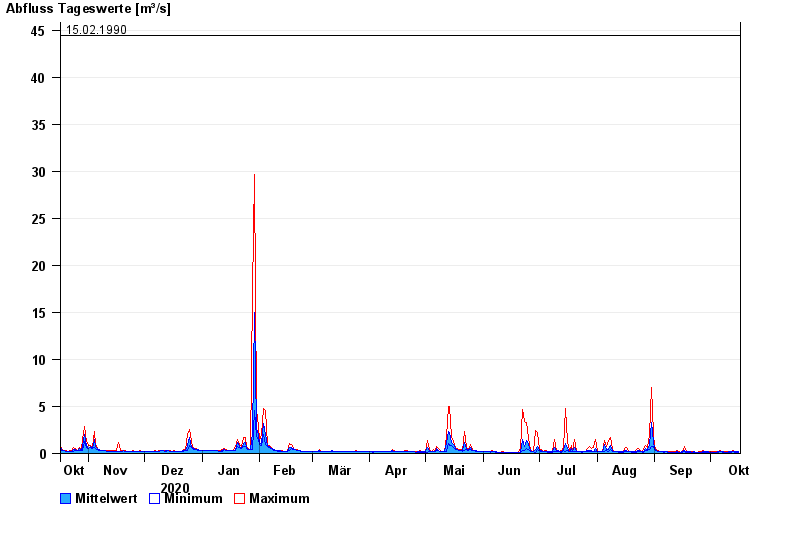
- Chart of year

Chart of year Kollbach / Kollbach
Discharge from 17.10.2020 to 16.10.2021
- 10.06.1965 Abfluss: 49 m³/s
- 22.06.1965 Abfluss: 48,1 m³/s
- 01.06.1965 Abfluss: 45,9 m³/s
- 02.06.1995 Abfluss: 45,5 m³/s
- 15.02.1990 Abfluss: 44,4 m³/s
| Date | Mean value [m³/s] | Maximum [m³/s] | Minimum [m³/s] |
|---|---|---|---|
| 16.10.2021 | 0.171 | 0.213 | 0.14 |
| 15.10.2021 | 0.163 | 0.192 | 0.156 |
| 14.10.2021 | 0.166 | 0.192 | 0.14 |
| 13.10.2021 | 0.24 | 0.339 | 0.192 |
| 12.10.2021 | 0.17 | 0.213 | 0.14 |
| 11.10.2021 | 0.168 | 0.258 | 0.126 |
| 10.10.2021 | 0.148 | 0.192 | 0.126 |
© Bayerisches Landesamt für Umwelt 2024