
- Start >
- Rivers >
- Discharge >
- Untere Donau >
- Kollbach >
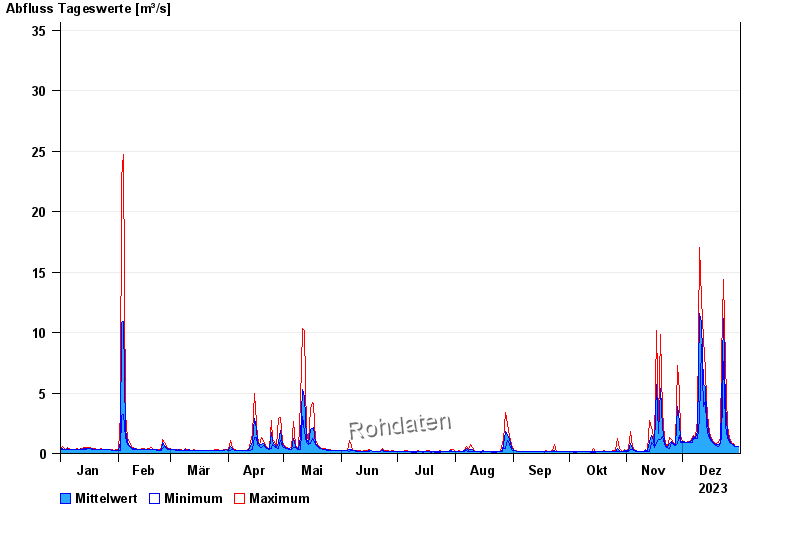
- Chart of year

Chart of year Kollbach / Kollbach
Discharge from 01.01.2023 to 31.12.2023
- 10.06.1965 Abfluss: 49 m³/s
- 22.06.1965 Abfluss: 48,1 m³/s
- 01.06.1965 Abfluss: 45,9 m³/s
- 02.06.1995 Abfluss: 45,5 m³/s
- 15.02.1990 Abfluss: 44,4 m³/s
| Date | Mean value [m³/s] | Maximum [m³/s] | Minimum [m³/s] |
|---|---|---|---|
| 31.12.2023 | 0.546 | 0.617 | 0.538 |
| 30.12.2023 | 0.584 | 0.617 | 0.577 |
| 29.12.2023 | 0.644 | 0.699 | 0.617 |
| 28.12.2023 | 0.714 | 0.787 | 0.658 |
| 27.12.2023 | 0.835 | 0.922 | 0.787 |
| 26.12.2023 | 1.09 | 1.25 | 0.922 |
| 25.12.2023 | 1.66 | 2.23 | 1.25 |
© Bayerisches Landesamt für Umwelt 2024