
- Start >
- Rivers >
- Discharge >
- Untere Donau >
- Kollbach >
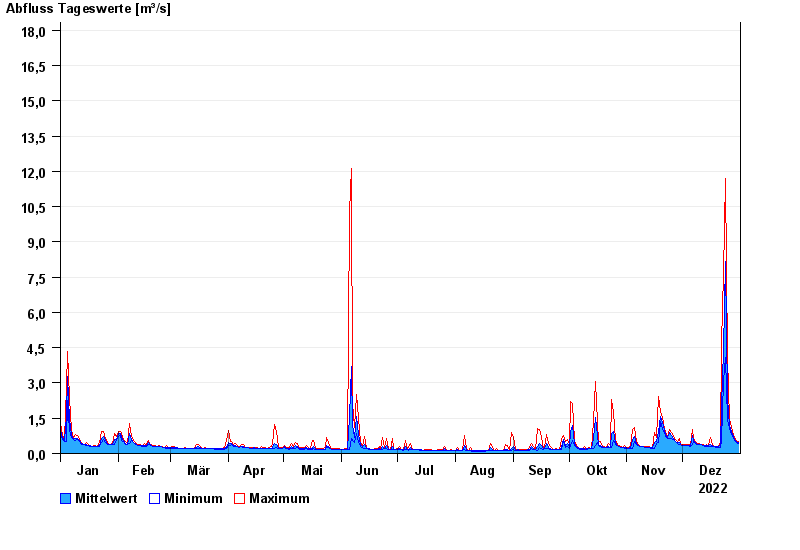
- Chart of year

Chart of year Kollbach / Kollbach
Discharge from 01.01.2022 to 31.12.2022
- 10.06.1965 Abfluss: 49 m³/s
- 22.06.1965 Abfluss: 48,1 m³/s
- 01.06.1965 Abfluss: 45,9 m³/s
- 02.06.1995 Abfluss: 45,5 m³/s
- 15.02.1990 Abfluss: 44,4 m³/s
| Date | Mean value [m³/s] | Maximum [m³/s] | Minimum [m³/s] |
|---|---|---|---|
| 31.12.2022 | 0.473 | 0.506 | 0.435 |
| 30.12.2022 | 0.51 | 0.544 | 0.47 |
| 29.12.2022 | 0.593 | 0.662 | 0.544 |
| 28.12.2022 | 0.71 | 0.788 | 0.662 |
| 27.12.2022 | 0.947 | 1.1 | 0.788 |
| 26.12.2022 | 1.18 | 1.46 | 1.06 |
| 25.12.2022 | 2.36 | 4.09 | 1.46 |
© Bayerisches Landesamt für Umwelt 2024