
- Start >
- Rivers >
- Discharge >
- Untere Donau >
- Köfering >
- Chart of total period

Chart of total period Köfering / Pfatter
Discharge from 01.11.1978 to 26.04.2024
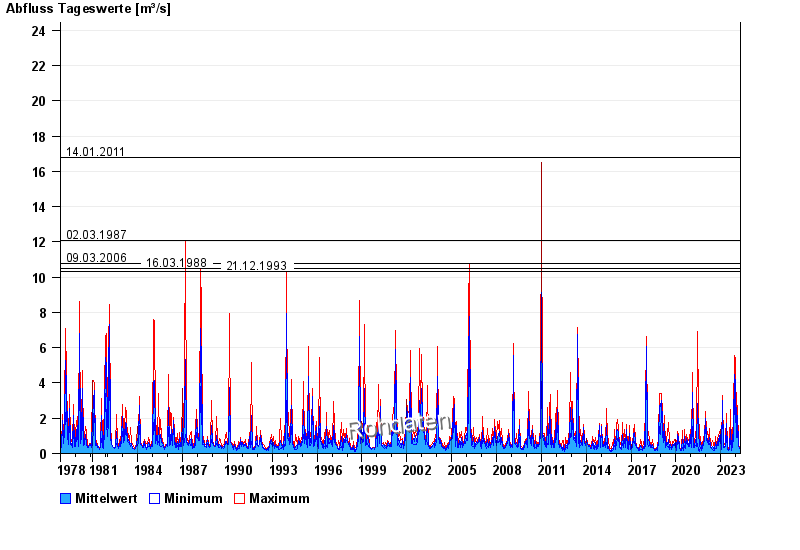
- 14.01.2011 Abfluss: 16,8 m³/s
- 02.03.1987 Abfluss: 12,1 m³/s
- 09.03.2006 Abfluss: 10,8 m³/s
- 16.03.1988 Abfluss: 10,5 m³/s
- 21.12.1993 Abfluss: 10,3 m³/s
| Date | Mean value [m³/s] | Maximum [m³/s] | Minimum [m³/s] |
|---|---|---|---|
| 26.04.2024 | 0.207 | 0.212 | 0.192 |
| 25.04.2024 | 0.216 | 0.233 | 0.212 |
| 24.04.2024 | 0.238 | 0.256 | 0.233 |
| 23.04.2024 | 0.253 | 0.282 | 0.233 |
| 22.04.2024 | 0.318 | 0.372 | 0.282 |
| 21.04.2024 | 0.37 | 0.522 | 0.256 |
| 20.04.2024 | 0.28 | 0.34 | 0.256 |
© Bayerisches Landesamt für Umwelt 2024