
- Start >
- Rivers >
- Discharge >
- Untere Donau >
- Köfering >
- Chart of total period

Chart of total period Köfering / Pfatter
Discharge from 01.11.1978 to 19.04.2024
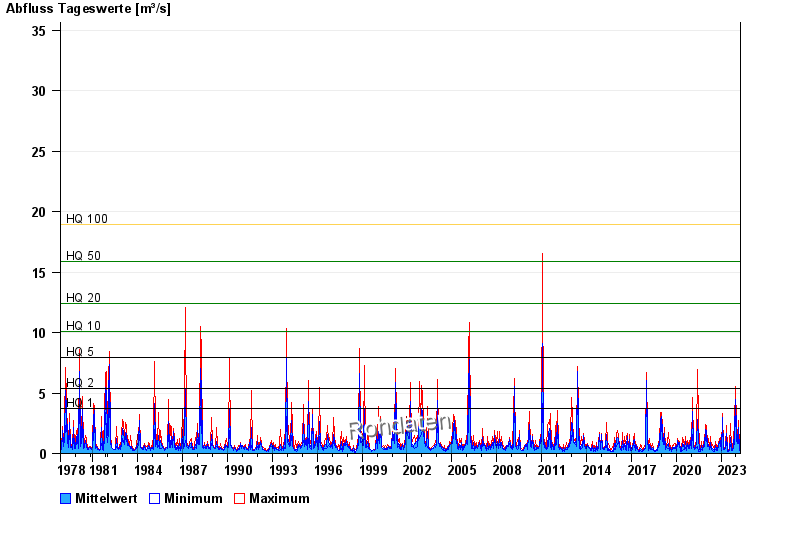
- HQ1 3,7 m³/s
- HQ2 5,4 m³/s
- HQ5 7,9 m³/s
- HQ10 10,1 m³/s
- HQ20 12,4 m³/s
- HQ50 15,9 m³/s
- HQ100 18,9 m³/s
| Date | Mean value [m³/s] | Maximum [m³/s] | Minimum [m³/s] |
|---|---|---|---|
| 19.04.2024 | 0.245 | 0.372 | 0.212 |
| 18.04.2024 | 0.243 | 0.256 | 0.233 |
| 17.04.2024 | 0.256 | 0.309 | 0.212 |
| 16.04.2024 | 0.21 | 0.233 | 0.192 |
| 15.04.2024 | 0.195 | 0.233 | 0.175 |
| 14.04.2024 | 0.181 | 0.192 | 0.175 |
| 13.04.2024 | 0.182 | 0.192 | 0.175 |
© Bayerisches Landesamt für Umwelt 2024