
- Start >
- Rivers >
- Discharge >
- Untere Donau >
- Hirschbach >
- Chart of total period

Chart of total period Hirschbach / Kleiner Regen
Discharge from 01.11.1966 to 09.05.2024
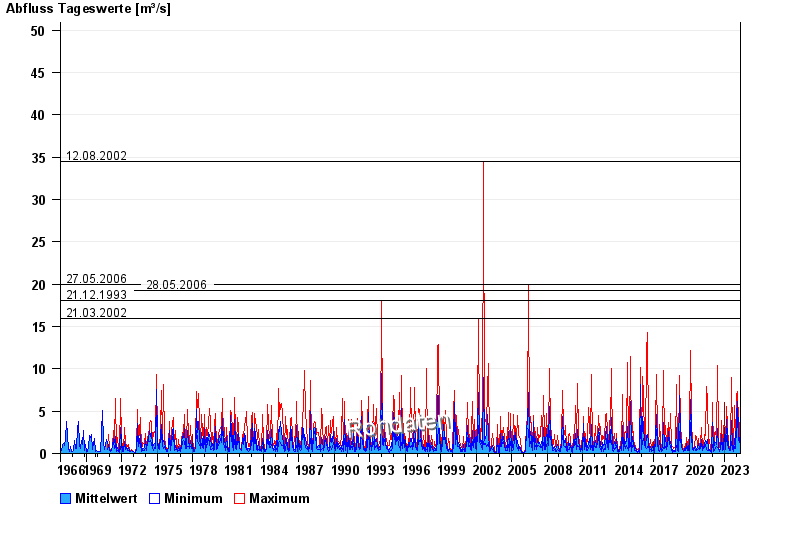
- 12.08.2002 Abfluss: 34,5 m³/s
- 27.05.2006 Abfluss: 20 m³/s
- 28.05.2006 Abfluss: 19,3 m³/s
- 21.12.1993 Abfluss: 18,1 m³/s
- 21.03.2002 Abfluss: 16 m³/s
| Date | Mean value [m³/s] | Maximum [m³/s] | Minimum [m³/s] |
|---|---|---|---|
| 09.05.2024 | 0.806 | 0.806 | 0.806 |
| 08.05.2024 | 1.01 | 1.25 | 0.806 |
| 07.05.2024 | 2.48 | 5.81 | 1.25 |
| 06.05.2024 | 0.938 | 4.64 | 0.609 |
| 05.05.2024 | 0.718 | 0.806 | 0.609 |
| 04.05.2024 | 0.782 | 0.806 | 0.737 |
| 03.05.2024 | 0.807 | 0.887 | 0.806 |
© Bayerisches Landesamt für Umwelt 2024