
- Start >
- Rivers >
- Discharge >
- Untere Donau >
- Hirschbach >
- Chart of total period

Chart of total period Hirschbach / Kleiner Regen
Discharge from 01.11.1966 to 25.04.2024
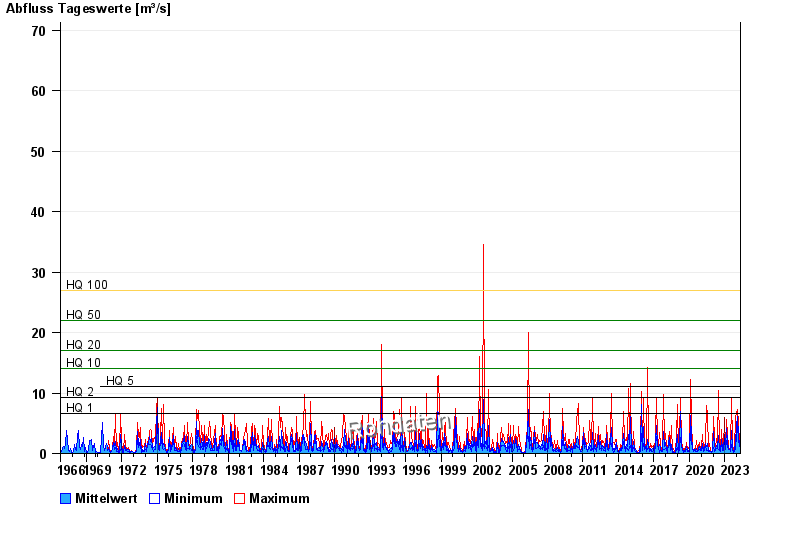
- HQ1 6,6 m³/s
- HQ2 9,2 m³/s
- HQ5 11 m³/s
- HQ10 14 m³/s
- HQ20 17 m³/s
- HQ50 22 m³/s
- HQ100 27 m³/s
| Date | Mean value [m³/s] | Maximum [m³/s] | Minimum [m³/s] |
|---|---|---|---|
| 25.04.2024 | 0.806 | 0.806 | 0.806 |
| 24.04.2024 | 0.806 | 0.806 | 0.806 |
| 23.04.2024 | 0.806 | 0.806 | 0.806 |
| 22.04.2024 | 0.818 | 0.887 | 0.806 |
| 21.04.2024 | 0.88 | 0.887 | 0.806 |
| 20.04.2024 | 0.806 | 0.806 | 0.806 |
| 19.04.2024 | 0.806 | 0.806 | 0.806 |
© Bayerisches Landesamt für Umwelt 2024