
- Start >
- Rivers >
- Discharge >
- Untere Donau >
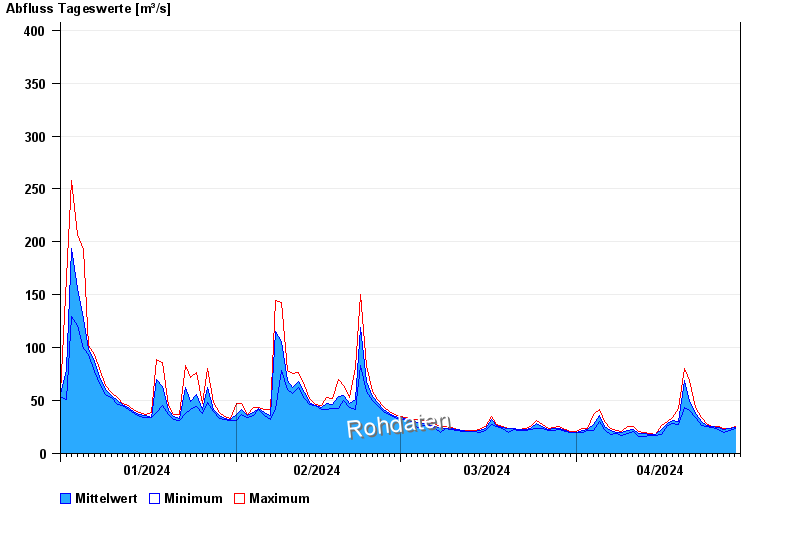
- Chamerau >
- Chart of year

Chart of year Chamerau / Regen
Discharge from 01.01.2024 to 29.04.2024
- 13.08.2002 Abfluss: 667 m³/s
- 30.05.1932 Abfluss: 441 m³/s
- 21.12.1993 Abfluss: 431 m³/s
- 09.07.1954 Abfluss: 424 m³/s
- 07.06.1936 Abfluss: 423 m³/s
| Date | Mean value [m³/s] | Maximum [m³/s] | Minimum [m³/s] |
|---|---|---|---|
| 29.04.2024 | 23.8 | 24 | 23.5 |
| 28.04.2024 | 23.2 | 24 | 21.3 |
| 27.04.2024 | 22.6 | 24 | 19.6 |
| 26.04.2024 | 24.1 | 25.4 | 22.6 |
| 25.04.2024 | 25.4 | 25.9 | 24.9 |
| 24.04.2024 | 26.6 | 28.3 | 25.4 |
| 23.04.2024 | 30.1 | 33.7 | 26.9 |
© Bayerisches Landesamt für Umwelt 2024