
- Start >
- Rivers >
- Discharge >
- Untere Donau >
- Chamerau >
- Chart of year

Chart of year Chamerau / Regen
Discharge from 01.01.2024 to 28.04.2024
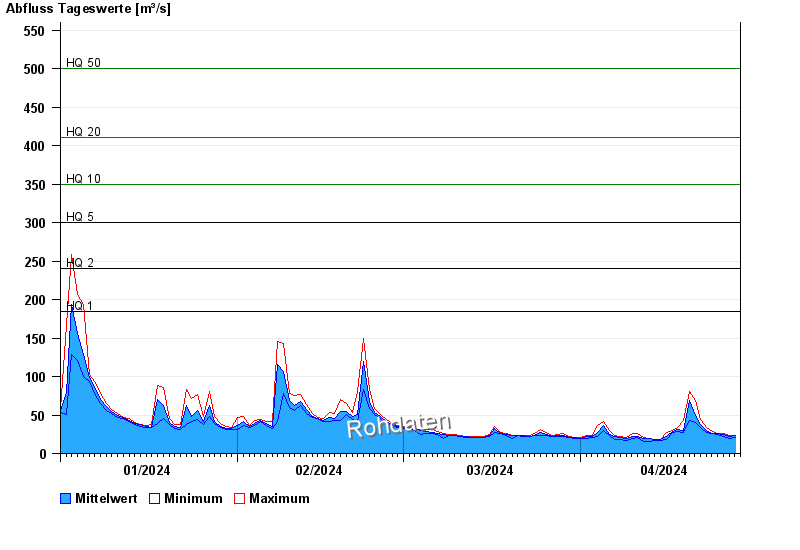
- HQ1 185 m³/s
- HQ2 240 m³/s
- HQ5 300 m³/s
- HQ10 350 m³/s
- HQ20 410 m³/s
- HQ50 500 m³/s
- HQ100 560 m³/s
| Date | Mean value [m³/s] | Maximum [m³/s] | Minimum [m³/s] |
|---|---|---|---|
| 28.04.2024 | 23.1 | 24 | 21.3 |
| 27.04.2024 | 22.6 | 24 | 19.6 |
| 26.04.2024 | 24.1 | 25.4 | 22.6 |
| 25.04.2024 | 25.4 | 25.9 | 24.9 |
| 24.04.2024 | 26.6 | 28.3 | 25.4 |
| 23.04.2024 | 30.1 | 33.7 | 26.9 |
| 22.04.2024 | 37.8 | 43.9 | 33.7 |
© Bayerisches Landesamt für Umwelt 2024