
- Start >
- Rivers >
- Discharge >
- Untere Donau >
- Auerbach >
- Chart of year

Chart of year Auerbach / Hengersberger Ohe
Discharge from 01.01.2019 to 31.12.2019
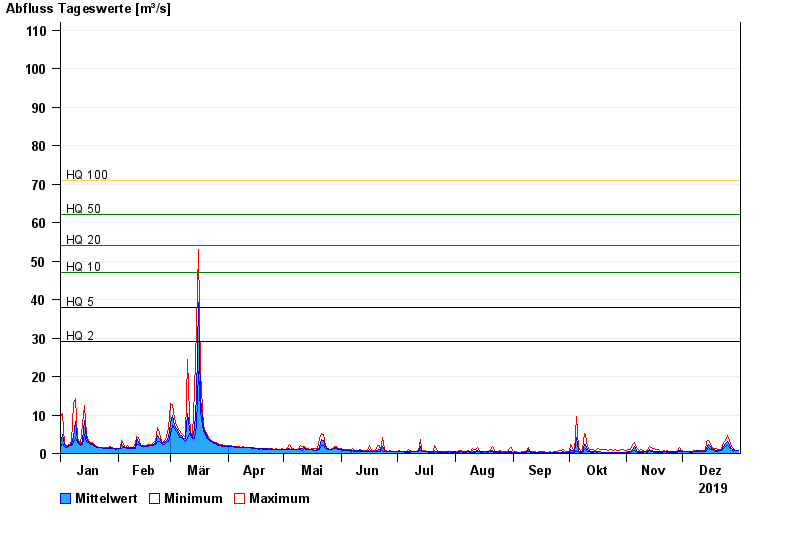
- HQ2 29 m³/s
- HQ5 38 m³/s
- HQ10 47 m³/s
- HQ20 54 m³/s
- HQ50 62 m³/s
- HQ100 71 m³/s
| Date | Mean value [m³/s] | Maximum [m³/s] | Minimum [m³/s] |
|---|---|---|---|
| 31.12.2019 | 0.749 | 0.788 | 0.718 |
| 30.12.2019 | 0.806 | 0.884 | 0.678 |
| 29.12.2019 | 0.908 | 0.997 | 0.833 |
| 28.12.2019 | 1.07 | 1.22 | 0.551 |
| 27.12.2019 | 1.38 | 1.79 | 1.18 |
| 26.12.2019 | 2.16 | 3.39 | 1.57 |
| 25.12.2019 | 3.05 | 4.8 | 2 |
© Bayerisches Landesamt für Umwelt 2024