
- Start >
- Rivers >
- Discharge >
- Untere Donau >
- Auerbach >
- Chart of year

Chart of year Auerbach / Hengersberger Ohe
Discharge from 01.01.2018 to 31.12.2018
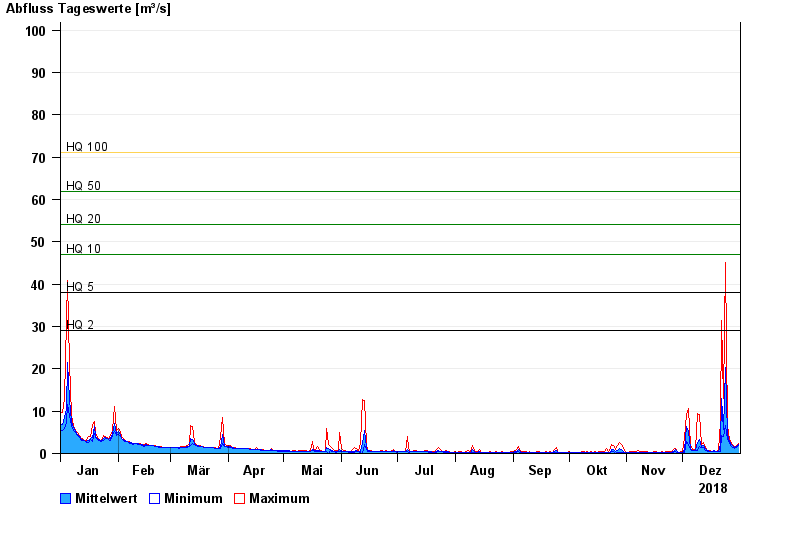
- HQ2 29 m³/s
- HQ5 38 m³/s
- HQ10 47 m³/s
- HQ20 54 m³/s
- HQ50 62 m³/s
- HQ100 71 m³/s
| Date | Mean value [m³/s] | Maximum [m³/s] | Minimum [m³/s] |
|---|---|---|---|
| 31.12.2018 | 2.11 | 2.4 | 1.97 |
| 30.12.2018 | 1.59 | 1.99 | 1.35 |
| 29.12.2018 | 1.42 | 1.5 | 1.27 |
| 28.12.2018 | 1.64 | 1.88 | 1.5 |
| 27.12.2018 | 2.04 | 2.29 | 1.76 |
| 26.12.2018 | 2.73 | 3.3 | 2.29 |
| 25.12.2018 | 4.55 | 6.5 | 3.3 |
© Bayerisches Landesamt für Umwelt 2024