
- Start >
- Rivers >
- Discharge >
- Untere Donau >
- Auerbach >
- Chart of year

Chart of year Auerbach / Hengersberger Ohe
Discharge from 09.12.2020 to 08.12.2021
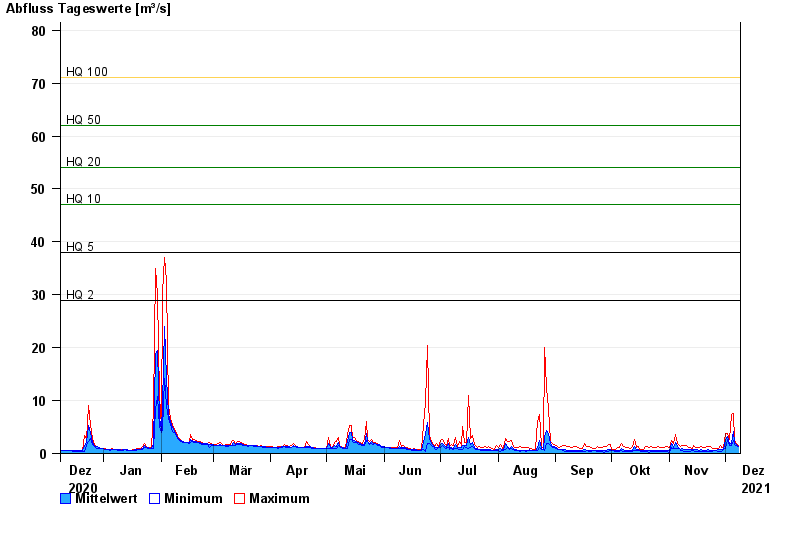
- HQ2 29 m³/s
- HQ5 38 m³/s
- HQ10 47 m³/s
- HQ20 54 m³/s
- HQ50 62 m³/s
- HQ100 71 m³/s
| Date | Mean value [m³/s] | Maximum [m³/s] | Minimum [m³/s] |
|---|---|---|---|
| 08.12.2021 | 1.39 | 1.5 | 1.26 |
| 07.12.2021 | 1.64 | 1.89 | 1.5 |
| 06.12.2021 | 2 | 2.42 | 1.74 |
| 05.12.2021 | 4.17 | 7.49 | 2.42 |
| 04.12.2021 | 1.93 | 7.4 | 1.42 |
| 03.12.2021 | 1.89 | 2.57 | 1.42 |
| 02.12.2021 | 3.2 | 3.71 | 2.57 |
© Bayerisches Landesamt für Umwelt 2024