
- Start >
- Rivers >
- Discharge >
- Untere Donau >
- Auerbach >
- Chart of year

Chart of year Auerbach / Hengersberger Ohe
Discharge from 09.12.2019 to 08.12.2020
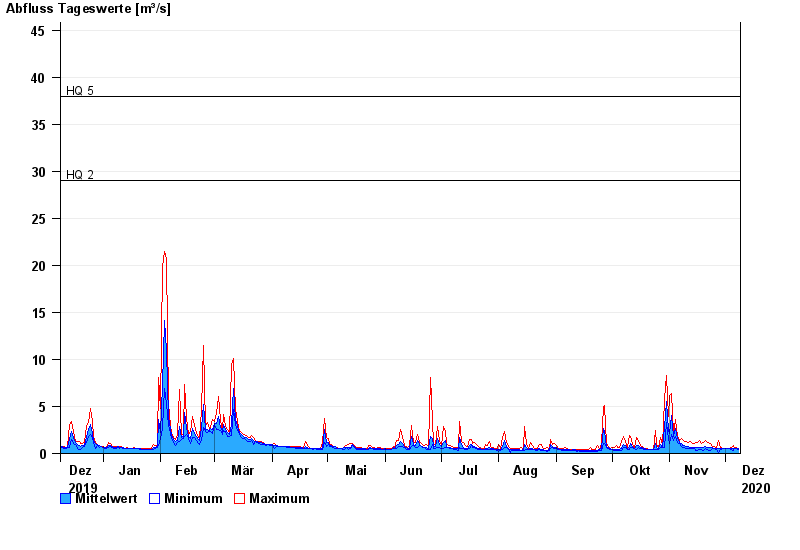
- HQ2 29 m³/s
- HQ5 38 m³/s
- HQ10 47 m³/s
- HQ20 54 m³/s
- HQ50 62 m³/s
- HQ100 71 m³/s
| Date | Mean value [m³/s] | Maximum [m³/s] | Minimum [m³/s] |
|---|---|---|---|
| 08.12.2020 | 0.482 | 0.547 | 0.433 |
| 07.12.2020 | 0.501 | 0.61 | 0.486 |
| 06.12.2020 | 0.514 | 0.546 | 0.485 |
| 05.12.2020 | 0.514 | 0.823 | 0.337 |
| 04.12.2020 | 0.495 | 0.607 | 0.429 |
| 03.12.2020 | 0.492 | 0.542 | 0.482 |
| 02.12.2020 | 0.502 | 0.541 | 0.481 |
© Bayerisches Landesamt für Umwelt 2024