
- Start >
- Rivers >
- Discharge >
- Untere Donau >
- Auerbach >
- Chart of year

Chart of year Auerbach / Hengersberger Ohe
Discharge from 09.12.2018 to 08.12.2019
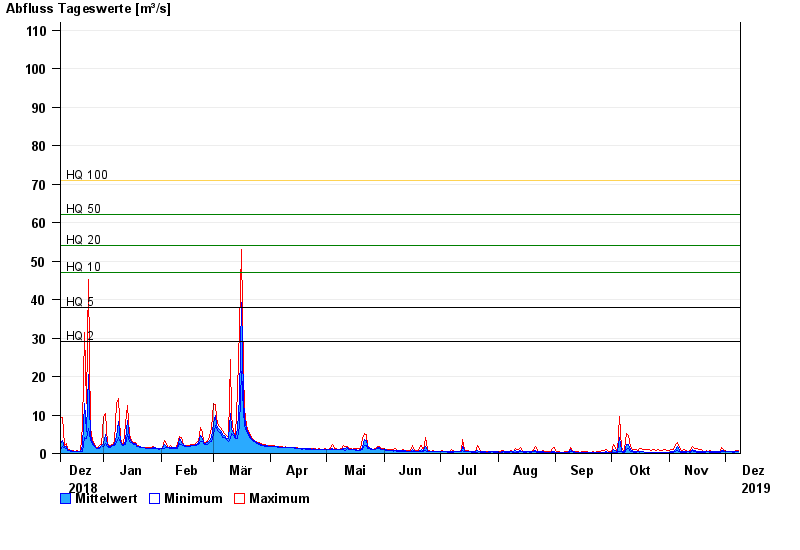
- HQ2 29 m³/s
- HQ5 38 m³/s
- HQ10 47 m³/s
- HQ20 54 m³/s
- HQ50 62 m³/s
- HQ100 71 m³/s
| Date | Mean value [m³/s] | Maximum [m³/s] | Minimum [m³/s] |
|---|---|---|---|
| 08.12.2019 | 0.634 | 0.719 | 0.514 |
| 07.12.2019 | 0.61 | 0.772 | 0.456 |
| 06.12.2019 | 0.479 | 0.516 | 0.382 |
| 05.12.2019 | 0.478 | 0.54 | 0.38 |
| 04.12.2019 | 0.483 | 0.535 | 0.424 |
| 03.12.2019 | 0.489 | 0.59 | 0.418 |
| 02.12.2019 | 0.53 | 0.6 | 0.47 |
© Bayerisches Landesamt für Umwelt 2024