
- Start >
- Rivers >
- Discharge >
- Untere Donau >
- Arzberg >
- Chart of year

Chart of year Arzberg / Röslau
Discharge from 17.10.2019 to 16.10.2020
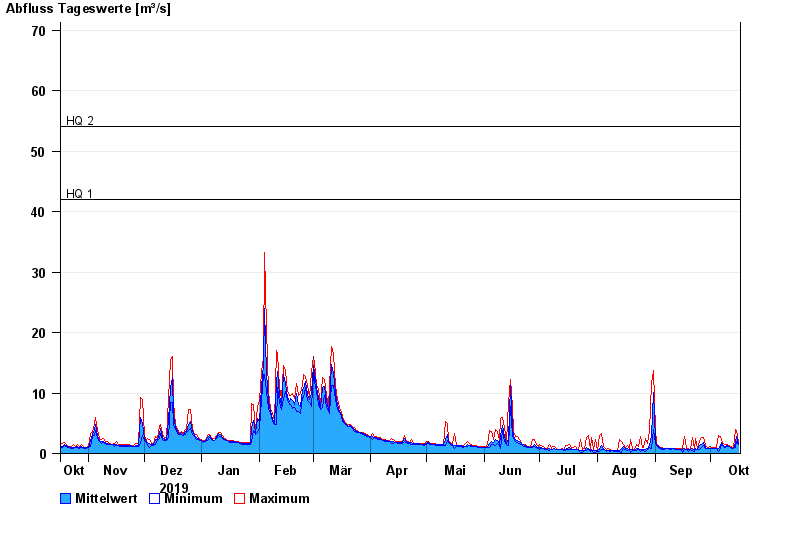
- HQ1 42 m³/s
- HQ2 54 m³/s
- HQ5 75 m³/s
- HQ10 90 m³/s
- HQ20 105 m³/s
- HQ50 124 m³/s
- HQ100 140 m³/s
| Date | Mean value [m³/s] | Maximum [m³/s] | Minimum [m³/s] |
|---|---|---|---|
| 16.10.2020 | 1.87 | 2.19 | 1.65 |
| 15.10.2020 | 3.09 | 4.01 | 2.19 |
| 14.10.2020 | 2.01 | 4.17 | 1.16 |
| 13.10.2020 | 1.03 | 1.16 | 0.904 |
| 12.10.2020 | 1.11 | 1.25 | 0.986 |
| 11.10.2020 | 1.36 | 1.44 | 1.25 |
| 10.10.2020 | 1.48 | 1.65 | 1.34 |
© Bayerisches Landesamt für Umwelt 2024