
- Start >
- Rivers >
- Discharge >
- Untere Donau >
- Arzberg >
- Chart of year

Chart of year Arzberg / Röslau
Discharge from 17.10.2020 to 16.10.2021
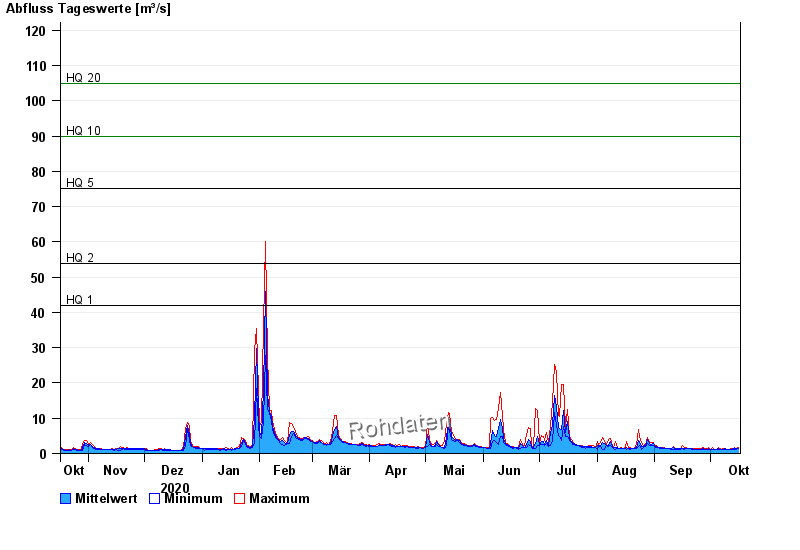
- HQ1 42 m³/s
- HQ2 54 m³/s
- HQ5 75 m³/s
- HQ10 90 m³/s
- HQ20 105 m³/s
- HQ50 124 m³/s
- HQ100 140 m³/s
| Date | Mean value [m³/s] | Maximum [m³/s] | Minimum [m³/s] |
|---|---|---|---|
| 16.10.2021 | 1.4 | 1.7 | 1.32 |
| 15.10.2021 | 1.37 | 1.5 | 1.24 |
| 14.10.2021 | 1.43 | 1.6 | 1.24 |
| 13.10.2021 | 1.36 | 1.5 | 1.15 |
| 12.10.2021 | 1.23 | 1.5 | 1.07 |
| 11.10.2021 | 1.1 | 1.24 | 0.993 |
| 10.10.2021 | 1.12 | 1.24 | 0.993 |
© Bayerisches Landesamt für Umwelt 2024