
- Start >
- Rivers >
- Discharge >
- Naab - Regen >
- Weiden Q >
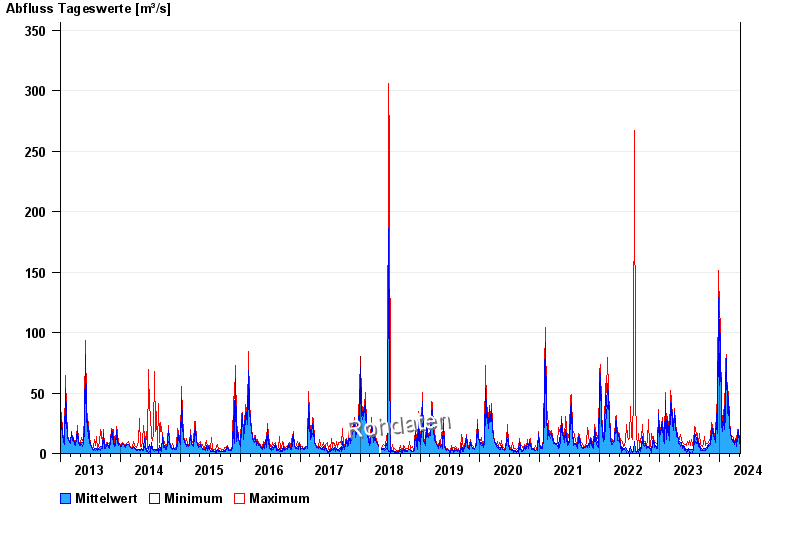
- Chart of total period

Chart of total period Weiden Q / Waldnaab
Discharge from 01.01.2013 to 06.05.2024
 Für diesen Pegel sind keine -Winter hinterlegt.
| Date | Mean value [m³/s] | Maximum [m³/s] | Minimum [m³/s] |
|---|---|---|---|
| 06.05.2024 | 6.15 | 6.7 | 5.5 |
| 05.05.2024 | 7.35 | 9.1 | 5.6 |
| 04.05.2024 | 8.12 | 11 | 6.5 |
| 03.05.2024 | 6.64 | 7.6 | 5.2 |
| 02.05.2024 | 6.48 | 7.1 | 6 |
| 01.05.2024 | 7.3 | 9.1 | 6.1 |
| 30.04.2024 | 6.92 | 8.5 | 5.5 |
© Bayerisches Landesamt für Umwelt 2024