
- Start >
- Rivers >
- Discharge >
- Naab - Regen >
- Weiden Q >
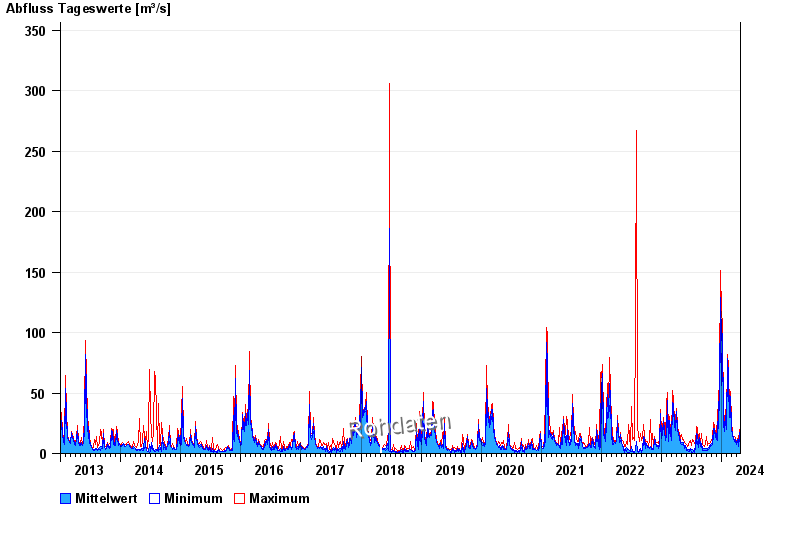
- Chart of total period

Chart of total period Weiden Q / Waldnaab
Discharge from 01.01.2013 to 24.04.2024
 Für diesen Pegel sind keine Hauptwerte hinterlegt.
| Date | Mean value [m³/s] | Maximum [m³/s] | Minimum [m³/s] |
|---|---|---|---|
| 24.04.2024 | 13.7 | 14 | 13.6 |
| 23.04.2024 | 16.3 | 18.7 | 13.9 |
| 22.04.2024 | 18.7 | 20.2 | 17 |
| 21.04.2024 | 15.5 | 19.5 | 13.4 |
| 20.04.2024 | 13.7 | 15.9 | 9.8 |
| 19.04.2024 | 6.88 | 9.8 | 5.8 |
| 18.04.2024 | 7.24 | 8.1 | 6.4 |
© Bayerisches Landesamt für Umwelt 2024