
- Start >
- Rivers >
- Discharge >
- Naab - Regen >
- Unterbruck Flutmulde >
- Chart of year

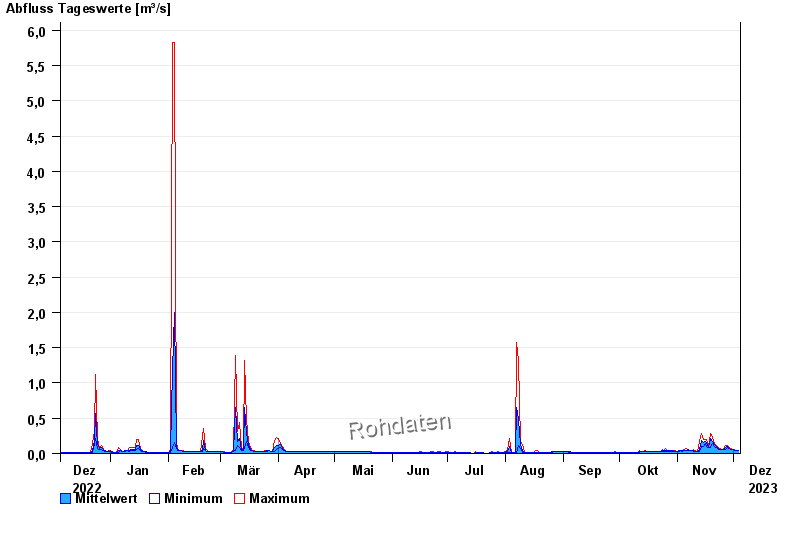
Chart of year Unterbruck Flutmulde / Haidenaab
Discharge from 05.12.2022 to 04.12.2023
| Date | Mean value [m³/s] | Maximum [m³/s] | Minimum [m³/s] |
|---|---|---|---|
| 04.12.2023 | 0.038 | 0.038 | 0.038 |
| 03.12.2023 | 0.042 | 0.045 | 0.038 |
| 02.12.2023 | 0.05 | 0.053 | 0.045 |
| 01.12.2023 | 0.054 | 0.057 | 0.053 |
| 30.11.2023 | 0.061 | 0.065 | 0.057 |
| 29.11.2023 | 0.074 | 0.086 | 0.065 |
| 28.11.2023 | 0.103 | 0.111 | 0.086 |
© Bayerisches Landesamt für Umwelt 2024