
- Start >
- Rivers >
- Discharge >
- Naab - Regen >
- Unterbruck Flutmulde >
- Chart of year

Chart of year Unterbruck Flutmulde / Haidenaab
Discharge from 05.12.2021 to 04.12.2022
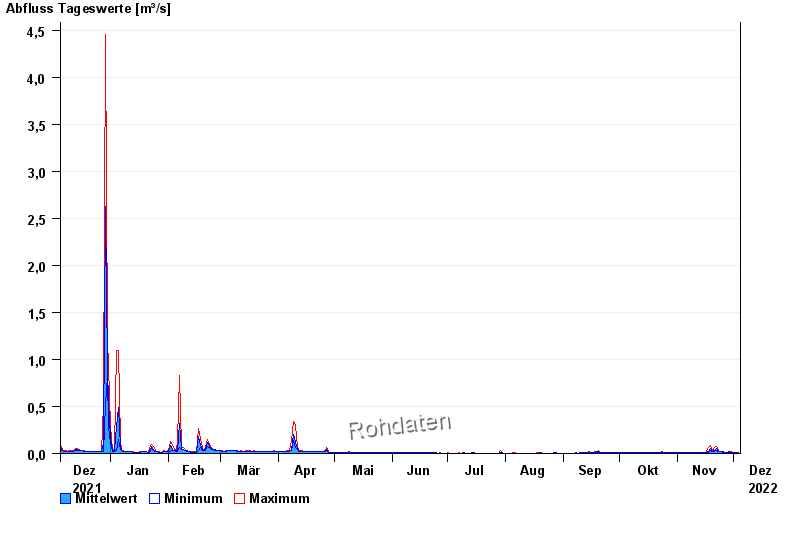
| Date | Mean value [m³/s] | Maximum [m³/s] | Minimum [m³/s] |
|---|---|---|---|
| 04.12.2022 | 0.014 | 0.014 | 0.013 |
| 03.12.2022 | 0.014 | 0.014 | 0.013 |
| 02.12.2022 | 0.014 | 0.014 | 0.014 |
| 01.12.2022 | 0.014 | 0.014 | 0.014 |
| 30.11.2022 | 0.016 | 0.017 | 0.014 |
| 29.11.2022 | 0.017 | 0.017 | 0.015 |
| 28.11.2022 | 0.015 | 0.015 | 0.015 |
© Bayerisches Landesamt für Umwelt 2024