
- Start >
- Rivers >
- Discharge >
- Naab - Regen >
- Ösbühl >
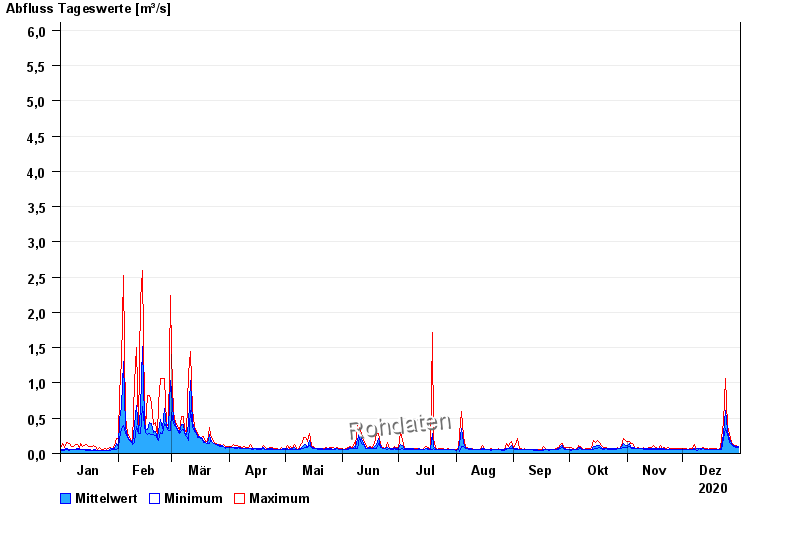
- Chart of year

Chart of year Ösbühl / Danglesbach
Discharge from 01.01.2020 to 31.12.2020
- HQ1 6,06 m³/s
- HQ2 7,3 m³/s
- HQ5 9,1 m³/s
- HQ10 10 m³/s
- HQ20 11 m³/s
- HQ50 13 m³/s
- HQ100 14 m³/s
| Date | Mean value [m³/s] | Maximum [m³/s] | Minimum [m³/s] |
|---|---|---|---|
| 31.12.2020 | 0.093 | 0.103 | 0.092 |
| 30.12.2020 | 0.103 | 0.114 | 0.092 |
| 29.12.2020 | 0.112 | 0.114 | 0.103 |
| 28.12.2020 | 0.115 | 0.125 | 0.103 |
| 27.12.2020 | 0.135 | 0.151 | 0.125 |
| 26.12.2020 | 0.194 | 0.266 | 0.151 |
| 25.12.2020 | 0.332 | 0.385 | 0.266 |
© Bayerisches Landesamt für Umwelt 2024