
- Start >
- Rivers >
- Discharge >
- Naab - Regen >
- Ösbühl >
- Chart of year

Chart of year Ösbühl / Danglesbach
Discharge from 01.01.2021 to 31.12.2021
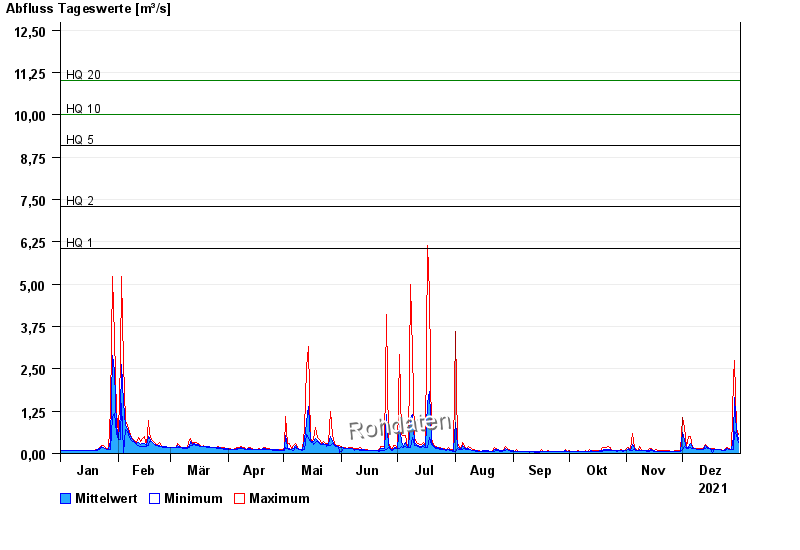
- HQ1 6,06 m³/s
- HQ2 7,3 m³/s
- HQ5 9,1 m³/s
- HQ10 10 m³/s
- HQ20 11 m³/s
- HQ50 13 m³/s
- HQ100 14 m³/s
| Date | Mean value [m³/s] | Maximum [m³/s] | Minimum [m³/s] |
|---|---|---|---|
| 31.12.2021 | 0.399 | 0.568 | 0.312 |
| 30.12.2021 | 0.648 | 0.741 | 0.546 |
| 29.12.2021 | 1.64 | 2.76 | 0.639 |
| 28.12.2021 | 0.458 | 2.2 | 0.109 |
| 27.12.2021 | 0.119 | 0.122 | 0.109 |
| 26.12.2021 | 0.132 | 0.148 | 0.122 |
| 25.12.2021 | 0.157 | 0.174 | 0.135 |
© Bayerisches Landesamt für Umwelt 2024