
- Start >
- Rivers >
- Discharge >
- Naab - Regen >
- Ösbühl >
- Chart of year

Chart of year Ösbühl / Danglesbach
Discharge from 01.01.2023 to 31.12.2023
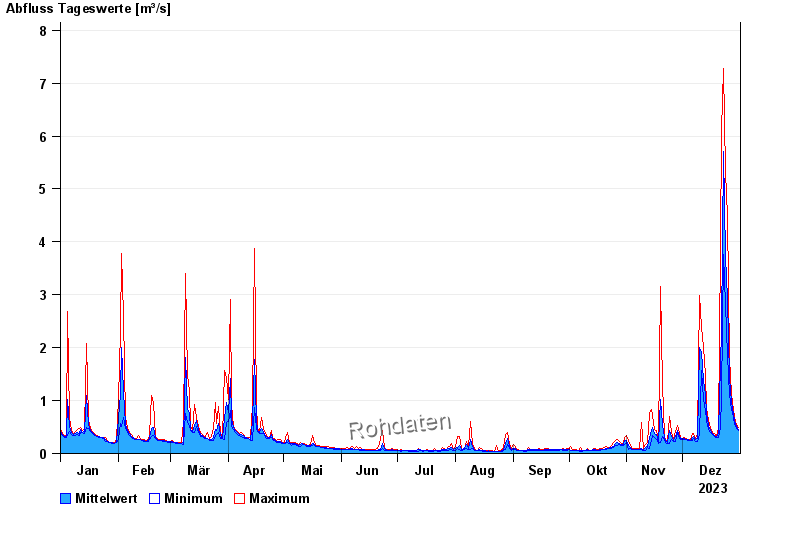
| Date | Mean value [m³/s] | Maximum [m³/s] | Minimum [m³/s] |
|---|---|---|---|
| 31.12.2023 | 0.458 | 0.492 | 0.431 |
| 30.12.2023 | 0.514 | 0.556 | 0.471 |
| 29.12.2023 | 0.619 | 0.674 | 0.556 |
| 28.12.2023 | 0.741 | 0.835 | 0.674 |
| 27.12.2023 | 0.956 | 1.12 | 0.835 |
| 26.12.2023 | 1.41 | 1.8 | 1.12 |
| 25.12.2023 | 2.92 | 4.5 | 1.85 |
© Bayerisches Landesamt für Umwelt 2024