
- Start >
- Rivers >
- Discharge >
- Naab - Regen >
- Ösbühl >
- Chart of year

Chart of year Ösbühl / Danglesbach
Discharge from 01.01.2022 to 31.12.2022
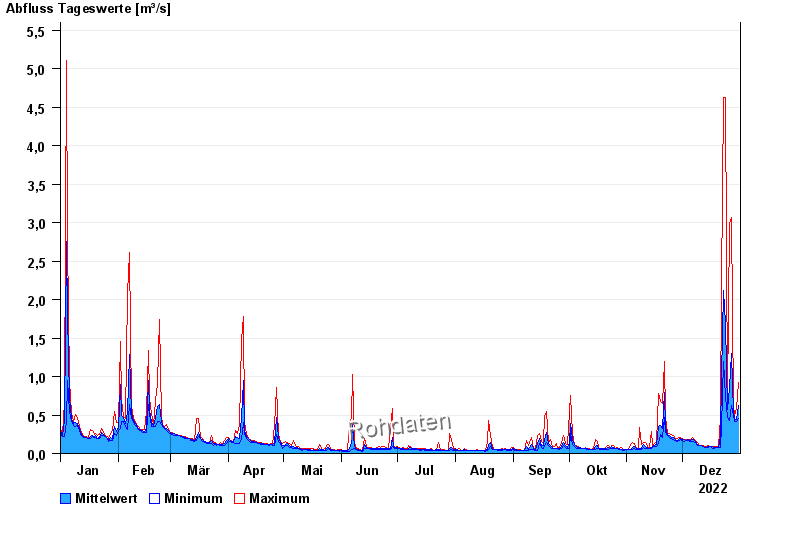
| Date | Mean value [m³/s] | Maximum [m³/s] | Minimum [m³/s] |
|---|---|---|---|
| 31.12.2022 | 0.626 | 0.925 | 0.453 |
| 30.12.2022 | 0.438 | 0.58 | 0.415 |
| 29.12.2022 | 0.449 | 0.494 | 0.415 |
| 28.12.2022 | 0.539 | 0.627 | 0.494 |
| 27.12.2022 | 1.3 | 3.07 | 0.627 |
| 26.12.2022 | 0.856 | 2.99 | 0.433 |
| 25.12.2022 | 0.571 | 0.727 | 0.474 |
© Bayerisches Landesamt für Umwelt 2024