
- Start >
- Rivers >
- Discharge >
- Naab - Regen >
- Geisleithen >
- Chart of total period

Chart of total period Geisleithen / Geisbach
Discharge from 22.07.2002 to 26.04.2024
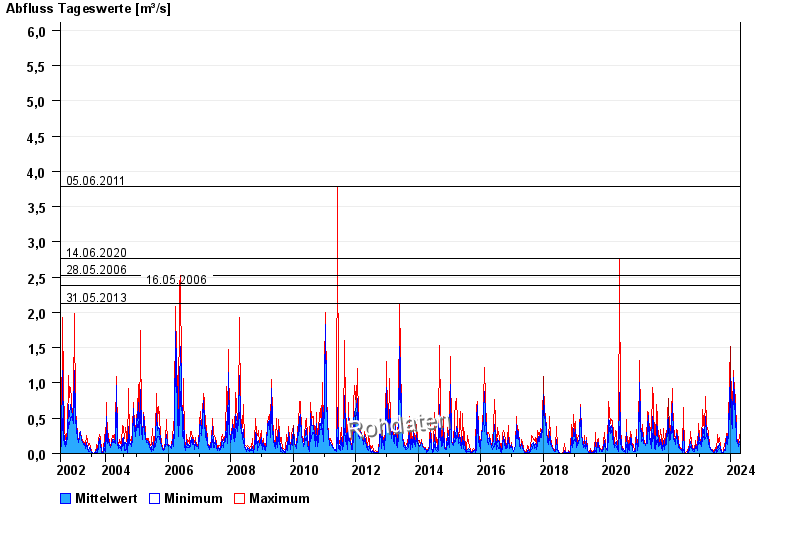
- 05.06.2011 Abfluss: 3,78 m³/s
- 14.06.2020 Abfluss: 2,76 m³/s
- 28.05.2006 Abfluss: 2,53 m³/s
- 16.05.2006 Abfluss: 2,38 m³/s
- 31.05.2013 Abfluss: 2,12 m³/s
| Date | Mean value [m³/s] | Maximum [m³/s] | Minimum [m³/s] |
|---|---|---|---|
| 26.04.2024 | 0.088 | 0.088 | 0.088 |
| 25.04.2024 | 0.091 | 0.101 | 0.088 |
| 24.04.2024 | 0.101 | 0.101 | 0.101 |
| 23.04.2024 | 0.117 | 0.133 | 0.101 |
| 22.04.2024 | 0.157 | 0.191 | 0.133 |
| 21.04.2024 | 0.157 | 0.214 | 0.077 |
| 20.04.2024 | 0.176 | 0.266 | 0.133 |
© Bayerisches Landesamt für Umwelt 2024