
- Start >
- Rivers >
- Discharge >
- Naab - Regen >
- Geisleithen >
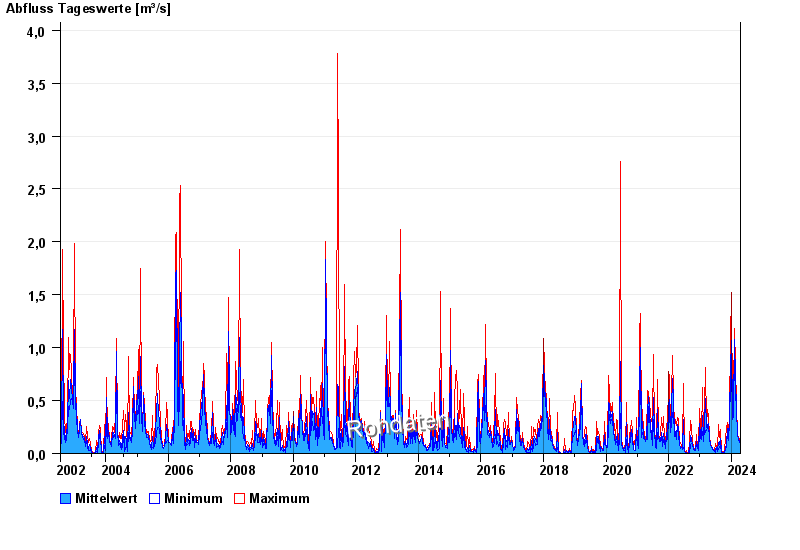
- Chart of total period

Chart of total period Geisleithen / Geisbach
Discharge from 22.07.2002 to 18.04.2024
| Date | Mean value [m³/s] | Maximum [m³/s] | Minimum [m³/s] |
|---|---|---|---|
| 18.04.2024 | 0.094 | 0.101 | 0.088 |
| 17.04.2024 | 0.116 | 0.15 | 0.101 |
| 16.04.2024 | 0.076 | 0.133 | 0.057 |
| 15.04.2024 | 0.056 | 0.066 | 0.049 |
| 14.04.2024 | 0.056 | 0.057 | 0.049 |
| 13.04.2024 | 0.057 | 0.057 | 0.057 |
| 12.04.2024 | 0.06 | 0.066 | 0.057 |
© Bayerisches Landesamt für Umwelt 2024