
- Start >
- Rivers >
- Discharge >
- Naab - Regen >
- Donauwörth >
- Chart of year

Chart of year Donauwörth / Donau
Discharge from 25.08.2018 to 24.08.2019
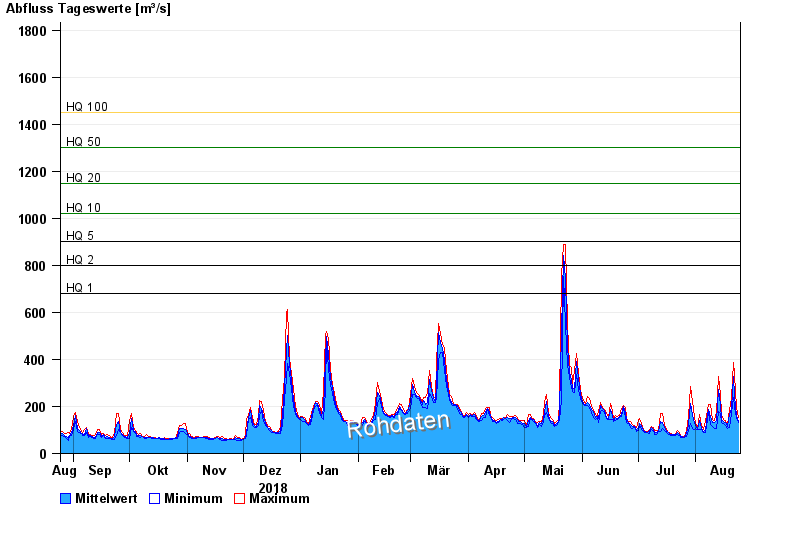
- HQ1 680 m³/s
- HQ2 800 m³/s
- HQ5 900 m³/s
- HQ10 1020 m³/s
- HQ20 1150 m³/s
- HQ50 1300 m³/s
- HQ100 1450 m³/s
| Date | Mean value [m³/s] | Maximum [m³/s] | Minimum [m³/s] |
|---|---|---|---|
| 24.08.2019 | 136 | 153 | 130 |
| 23.08.2019 | 162 | 194 | 153 |
| 22.08.2019 | 243 | 334 | 194 |
| 21.08.2019 | 329 | 387 | 237 |
| 20.08.2019 | 191 | 235 | 168 |
| 19.08.2019 | 165 | 187 | 109 |
| 18.08.2019 | 116 | 119 | 107 |
© Bayerisches Landesamt für Umwelt 2024