
- Start >
- Rivers >
- Discharge >
- Naab - Regen >
- Donauwörth >
- Chart of year

Chart of year Donauwörth / Donau
Discharge from 25.08.2019 to 24.08.2020
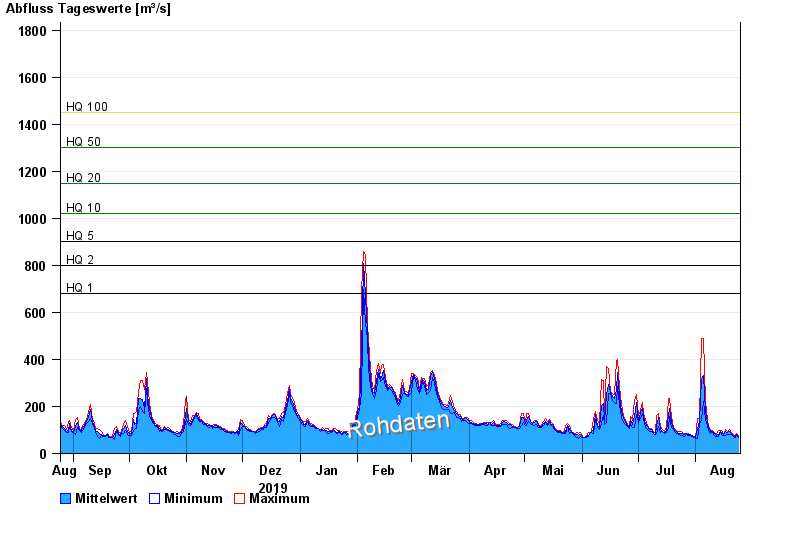
- HQ1 680 m³/s
- HQ2 800 m³/s
- HQ5 900 m³/s
- HQ10 1020 m³/s
- HQ20 1150 m³/s
- HQ50 1300 m³/s
- HQ100 1450 m³/s
| Date | Mean value [m³/s] | Maximum [m³/s] | Minimum [m³/s] |
|---|---|---|---|
| 24.08.2020 | 73 | 76 | 67.6 |
| 23.08.2020 | 81.1 | 86 | 76 |
| 22.08.2020 | 72.3 | 75 | 68.6 |
| 21.08.2020 | 74.8 | 81.6 | 72.9 |
| 20.08.2020 | 84.6 | 88.1 | 81.6 |
| 19.08.2020 | 95.6 | 102 | 82.6 |
| 18.08.2020 | 90.2 | 95 | 82.6 |
© Bayerisches Landesamt für Umwelt 2024