
- Start >
- Rivers >
- Discharge >
- Naab - Regen >
- Böhmischbruck >
- Chart of year

Chart of year Böhmischbruck / Pfreimd
Discharge from 27.10.2019 to 26.10.2020
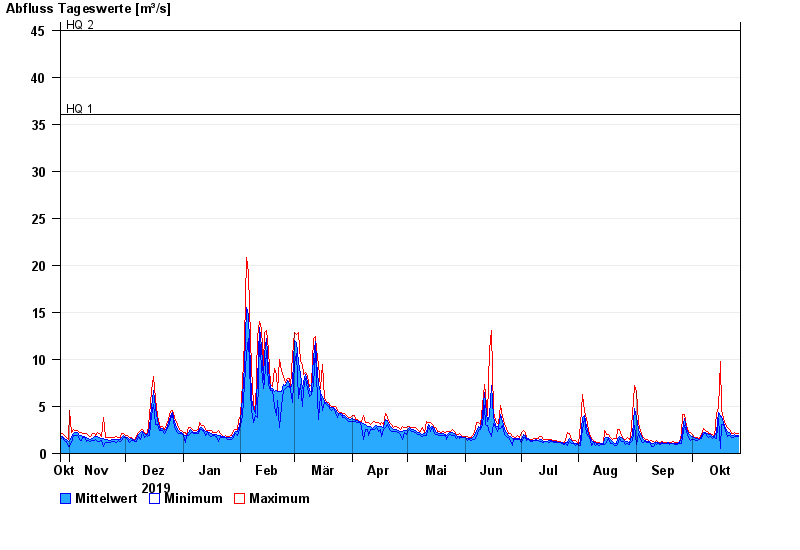
- HQ1 36 m³/s
- HQ2 45 m³/s
- HQ5 55 m³/s
- HQ10 65 m³/s
- HQ20 75 m³/s
- HQ50 90 m³/s
- HQ100 100 m³/s
| Date | Mean value [m³/s] | Maximum [m³/s] | Minimum [m³/s] |
|---|---|---|---|
| 26.10.2020 | 1.94 | 2.09 | 1.79 |
| 25.10.2020 | 1.94 | 2.09 | 1.8 |
| 24.10.2020 | 2 | 2.25 | 1.8 |
| 23.10.2020 | 1.9 | 2.1 | 1.66 |
| 22.10.2020 | 1.92 | 2.11 | 1.67 |
| 21.10.2020 | 2.22 | 2.59 | 1.96 |
| 20.10.2020 | 2.3 | 2.77 | 1.82 |
© Bayerisches Landesamt für Umwelt 2024