
- Start >
- Rivers >
- Discharge >
- Naab - Regen >
- Böhmischbruck >
- Chart of year

Chart of year Böhmischbruck / Pfreimd
Discharge from 27.10.2020 to 26.10.2021
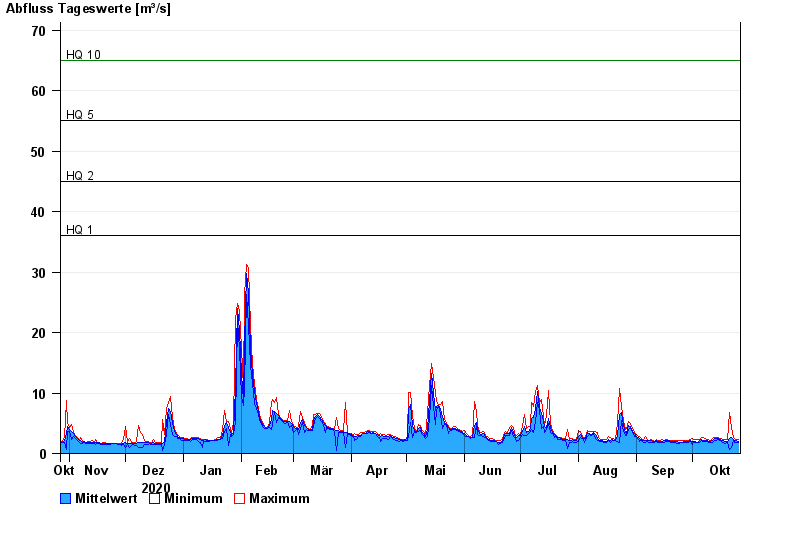
- HQ1 36 m³/s
- HQ2 45 m³/s
- HQ5 55 m³/s
- HQ10 65 m³/s
- HQ20 75 m³/s
- HQ50 90 m³/s
- HQ100 100 m³/s
| Date | Mean value [m³/s] | Maximum [m³/s] | Minimum [m³/s] |
|---|---|---|---|
| 26.10.2021 | 2.04 | 2.34 | 1.74 |
| 25.10.2021 | 2.11 | 2.34 | 1.88 |
| 24.10.2021 | 2.22 | 2.5 | 1.87 |
| 23.10.2021 | 2.38 | 2.66 | 2.17 |
| 22.10.2021 | 2.59 | 4.32 | 0.999 |
| 21.10.2021 | 2.44 | 6.81 | 0.635 |
| 20.10.2021 | 2 | 2.32 | 1.86 |
© Bayerisches Landesamt für Umwelt 2024