
- Start >
- Rivers >
- Discharge >
- Unterer Main >
- Stockheim >
- Chart of total period

Chart of total period Stockheim / Sulz
Discharge from 01.11.1973 to 26.04.2024
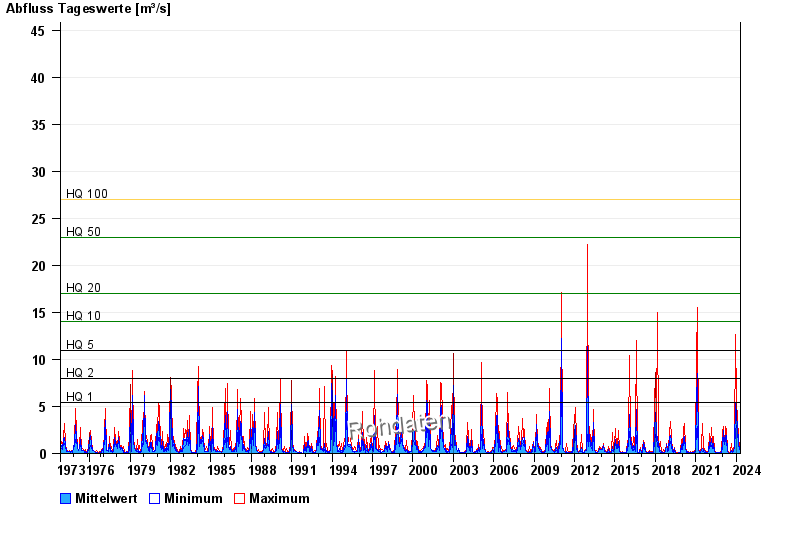
- HQ1 5,4 m³/s
- HQ2 8 m³/s
- HQ5 11 m³/s
- HQ10 14 m³/s
- HQ20 17 m³/s
- HQ50 23 m³/s
- HQ100 27 m³/s
| Date | Mean value [m³/s] | Maximum [m³/s] | Minimum [m³/s] |
|---|---|---|---|
| 26.04.2024 | 0.193 | 0.197 | 0.177 |
| 25.04.2024 | 0.197 | 0.197 | 0.177 |
| 24.04.2024 | 0.198 | 0.217 | 0.197 |
| 23.04.2024 | 0.215 | 0.237 | 0.197 |
| 22.04.2024 | 0.265 | 0.325 | 0.237 |
| 21.04.2024 | 0.334 | 0.395 | 0.28 |
| 20.04.2024 | 0.283 | 0.302 | 0.259 |
© Bayerisches Landesamt für Umwelt 2024