
- Start >
- Rivers >
- Discharge >
- Unterer Main >
- Stockheim >
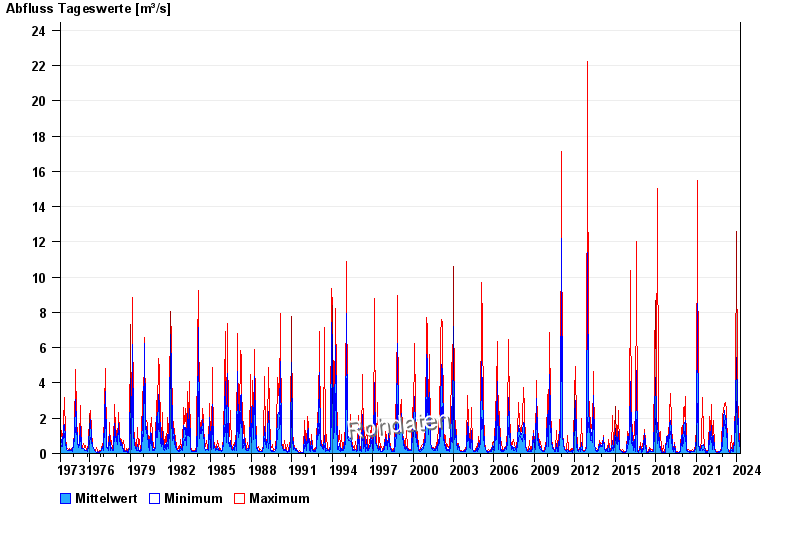
- Chart of total period

Chart of total period Stockheim / Sulz
Discharge from 01.11.1973 to 19.04.2024
| Date | Mean value [m³/s] | Maximum [m³/s] | Minimum [m³/s] |
|---|---|---|---|
| 19.04.2024 | 0.186 | 0.197 | 0.177 |
| 18.04.2024 | 0.224 | 0.237 | 0.197 |
| 17.04.2024 | 0.225 | 0.259 | 0.197 |
| 16.04.2024 | 0.197 | 0.259 | 0.177 |
| 15.04.2024 | 0.176 | 0.217 | 0.159 |
| 14.04.2024 | 0.173 | 0.177 | 0.159 |
| 13.04.2024 | 0.176 | 0.177 | 0.159 |
© Bayerisches Landesamt für Umwelt 2024