
- Start >
- Rivers >
- Discharge >
- Unterer Main >
- Rück >
- Chart of year

Chart of year Rück / Elsava
Discharge from 26.08.2018 to 25.08.2019
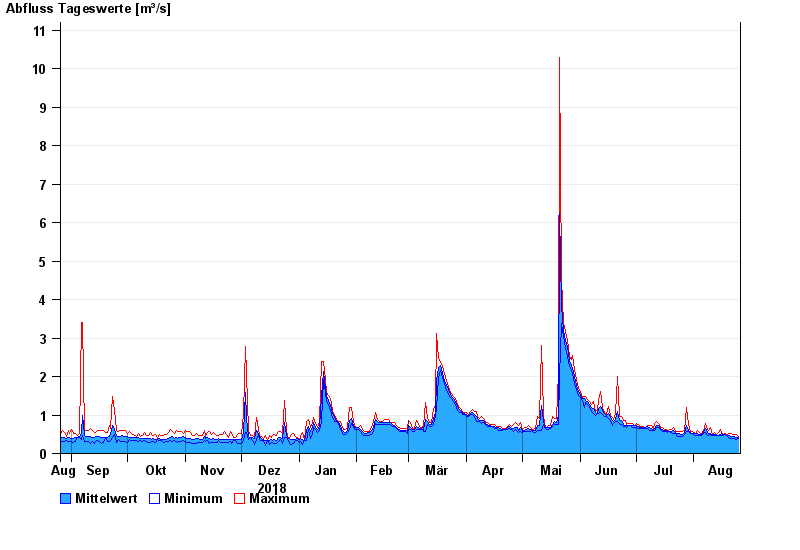
| Date | Mean value [m³/s] | Maximum [m³/s] | Minimum [m³/s] |
|---|---|---|---|
| 25.08.2019 | 0.418 | 0.447 | 0.381 |
| 24.08.2019 | 0.422 | 0.485 | 0.351 |
| 23.08.2019 | 0.429 | 0.486 | 0.382 |
| 22.08.2019 | 0.444 | 0.488 | 0.383 |
| 21.08.2019 | 0.451 | 0.528 | 0.384 |
| 20.08.2019 | 0.463 | 0.529 | 0.385 |
| 19.08.2019 | 0.479 | 0.492 | 0.454 |
© Bayerisches Landesamt für Umwelt 2024