
- Start >
- Rivers >
- Discharge >
- Unterer Main >
- Rück >
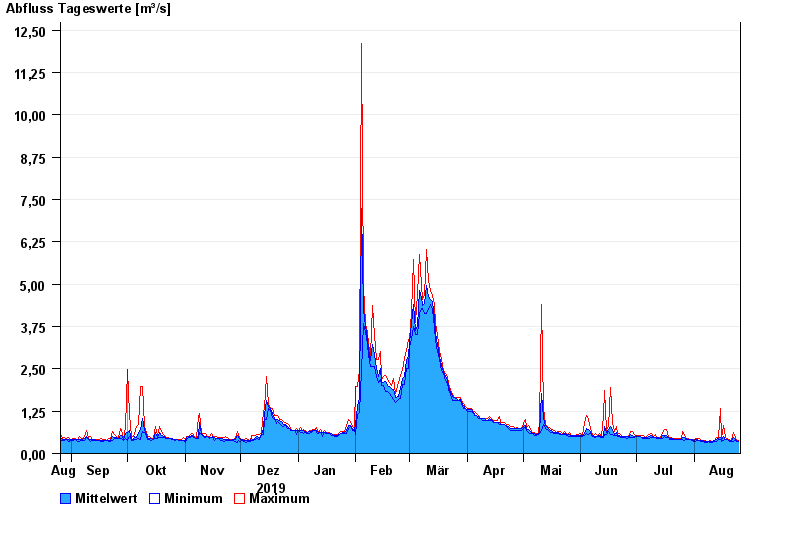
- Chart of year

Chart of year Rück / Elsava
Discharge from 26.08.2019 to 25.08.2020
| Date | Mean value [m³/s] | Maximum [m³/s] | Minimum [m³/s] |
|---|---|---|---|
| 25.08.2020 | 0.363 | 0.389 | 0.357 |
| 24.08.2020 | 0.383 | 0.391 | 0.359 |
| 23.08.2020 | 0.411 | 0.46 | 0.391 |
| 22.08.2020 | 0.47 | 0.62 | 0.364 |
| 21.08.2020 | 0.384 | 0.397 | 0.364 |
| 20.08.2020 | 0.392 | 0.399 | 0.367 |
| 19.08.2020 | 0.405 | 0.433 | 0.399 |
© Bayerisches Landesamt für Umwelt 2024