
- Start >
- Rivers >
- Discharge >
- Unterer Main >
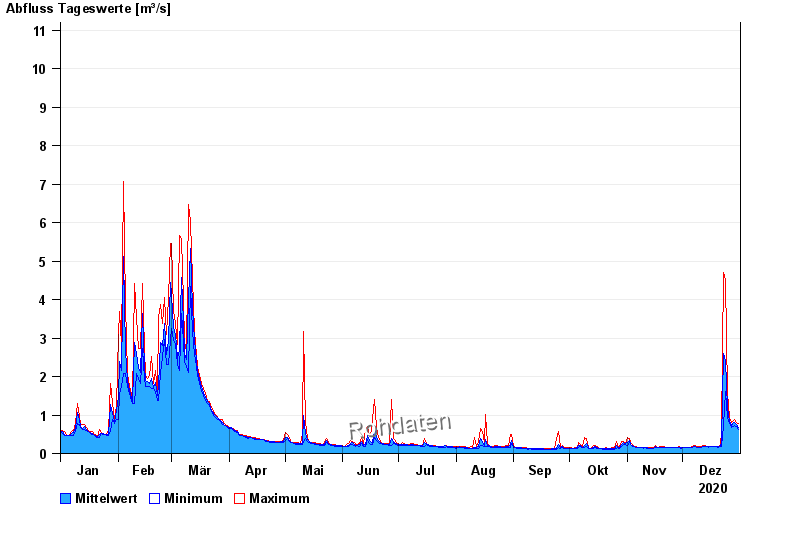
- Oberthulba >
- Chart of year

Chart of year Oberthulba / Thulba
Discharge from 01.01.2020 to 31.12.2020
- 07.02.1984 Abfluss: 45,6 m³/s
- 23.01.1995 Abfluss: 43,5 m³/s
- 03.01.2003 Abfluss: 42,1 m³/s
- 13.01.2011 Abfluss: 30,1 m³/s
- 21.01.2005 Abfluss: 30,1 m³/s
| Date | Mean value [m³/s] | Maximum [m³/s] | Minimum [m³/s] |
|---|---|---|---|
| 31.12.2020 | 0.683 | 0.778 | 0.627 |
| 30.12.2020 | 0.754 | 0.812 | 0.7 |
| 29.12.2020 | 0.816 | 0.895 | 0.738 |
| 28.12.2020 | 0.807 | 0.853 | 0.7 |
| 27.12.2020 | 0.723 | 0.812 | 0.664 |
| 26.12.2020 | 0.843 | 0.936 | 0.778 |
| 25.12.2020 | 1.19 | 1.55 | 0.936 |
© Bayerisches Landesamt für Umwelt 2024