
- Start >
- Rivers >
- Discharge >
- Unterer Main >
- Oberthulba >
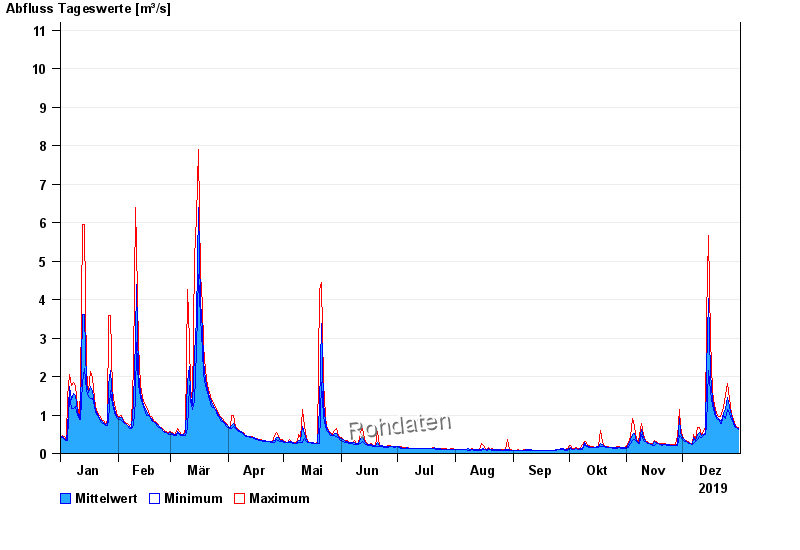
- Chart of year

Chart of year Oberthulba / Thulba
Discharge from 01.01.2019 to 31.12.2019
- 07.02.1984 Abfluss: 45,6 m³/s
- 23.01.1995 Abfluss: 43,5 m³/s
- 03.01.2003 Abfluss: 42,1 m³/s
- 13.01.2011 Abfluss: 30,1 m³/s
- 21.01.2005 Abfluss: 30,1 m³/s
| Date | Mean value [m³/s] | Maximum [m³/s] | Minimum [m³/s] |
|---|---|---|---|
| 31.12.2019 | 0.638 | 0.668 | 0.63 |
| 30.12.2019 | 0.676 | 0.708 | 0.668 |
| 29.12.2019 | 0.742 | 0.789 | 0.708 |
| 28.12.2019 | 0.837 | 0.872 | 0.789 |
| 27.12.2019 | 0.976 | 1.04 | 0.872 |
| 26.12.2019 | 1.21 | 1.44 | 1.04 |
| 25.12.2019 | 1.46 | 1.81 | 1.14 |
© Bayerisches Landesamt für Umwelt 2024