
- Start >
- Rivers >
- Discharge >
- Unterer Main >
- Oberthulba >
- Chart of year

Chart of year Oberthulba / Thulba
Discharge from 01.01.2019 to 31.12.2019
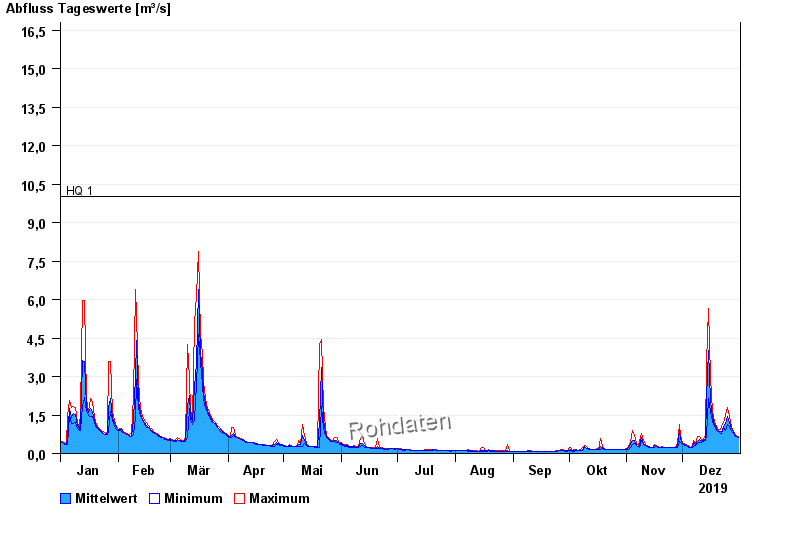
- HQ1 10 m³/s
- HQ2 17 m³/s
- HQ5 26 m³/s
- HQ10 33 m³/s
- HQ20 40 m³/s
- HQ50 50 m³/s
- HQ100 57 m³/s
| Date | Mean value [m³/s] | Maximum [m³/s] | Minimum [m³/s] |
|---|---|---|---|
| 31.12.2019 | 0.535 | 0.558 | 0.521 |
| 30.12.2019 | 0.552 | 0.576 | 0.532 |
| 29.12.2019 | 0.6 | 0.641 | 0.576 |
| 28.12.2019 | 0.673 | 0.701 | 0.641 |
| 27.12.2019 | 0.787 | 0.852 | 0.697 |
| 26.12.2019 | 0.989 | 1.22 | 0.844 |
| 25.12.2019 | 1.23 | 1.55 | 0.945 |
© Bayerisches Landesamt für Umwelt 2025