
- Start >
- Rivers >
- Discharge >
- Unterer Main >
- Oberthulba >
- Chart of year

Chart of year Oberthulba / Thulba
Discharge from 01.01.2018 to 31.12.2018
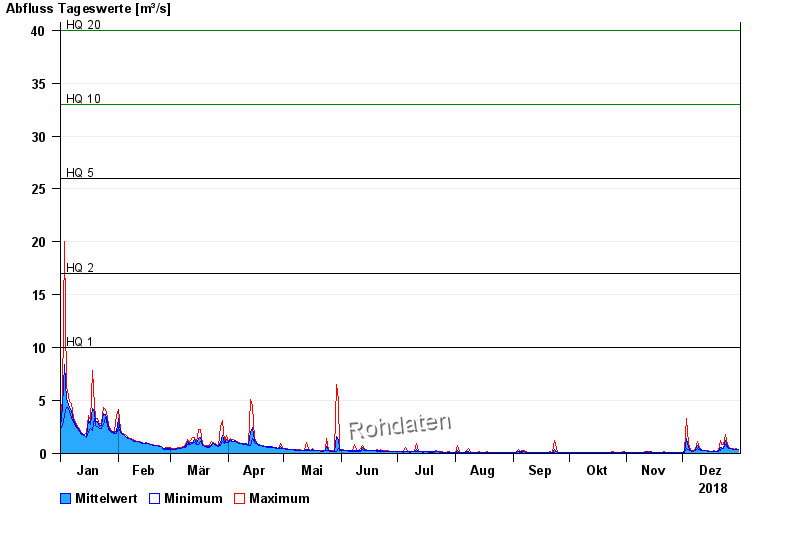
- HQ1 10 m³/s
- HQ2 17 m³/s
- HQ5 26 m³/s
- HQ10 33 m³/s
- HQ20 40 m³/s
- HQ50 50 m³/s
- HQ100 57 m³/s
| Date | Mean value [m³/s] | Maximum [m³/s] | Minimum [m³/s] |
|---|---|---|---|
| 31.12.2018 | 0.287 | 0.296 | 0.28 |
| 30.12.2018 | 0.298 | 0.323 | 0.268 |
| 29.12.2018 | 0.276 | 0.285 | 0.266 |
| 28.12.2018 | 0.302 | 0.323 | 0.283 |
| 27.12.2018 | 0.335 | 0.351 | 0.321 |
| 26.12.2018 | 0.379 | 0.421 | 0.349 |
| 25.12.2018 | 0.504 | 0.63 | 0.419 |
© Bayerisches Landesamt für Umwelt 2025