
- Start >
- Rivers >
- Discharge >
- Unterer Main >
- Lentersdorf >
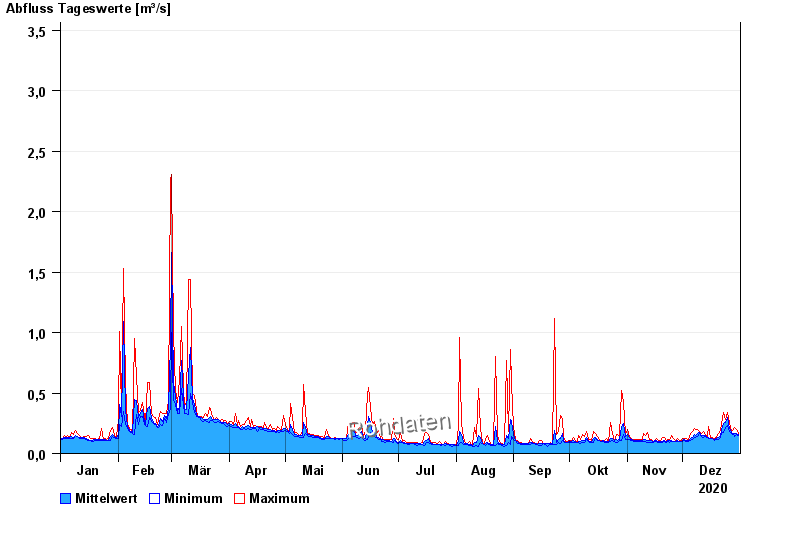
- Chart of year

Chart of year Lentersdorf / Bibert
Discharge from 01.01.2020 to 31.12.2020
- 12.03.1979 Abfluss: 16,4 m³/s
- 16.03.1988 Abfluss: 16,2 m³/s
- 13.04.1994 Abfluss: 14 m³/s
- 21.12.1993 Abfluss: 13,7 m³/s
- 09.03.2006 Abfluss: 12,2 m³/s
| Date | Mean value [m³/s] | Maximum [m³/s] | Minimum [m³/s] |
|---|---|---|---|
| 31.12.2020 | 0.156 | 0.162 | 0.148 |
| 30.12.2020 | 0.168 | 0.199 | 0.161 |
| 29.12.2020 | 0.166 | 0.215 | 0.141 |
| 28.12.2020 | 0.166 | 0.199 | 0.154 |
| 27.12.2020 | 0.17 | 0.181 | 0.166 |
| 26.12.2020 | 0.206 | 0.257 | 0.181 |
| 25.12.2020 | 0.295 | 0.341 | 0.228 |
© Bayerisches Landesamt für Umwelt 2024