
- Start >
- Rivers >
- Discharge >
- Unterer Main >
- Lentersdorf >
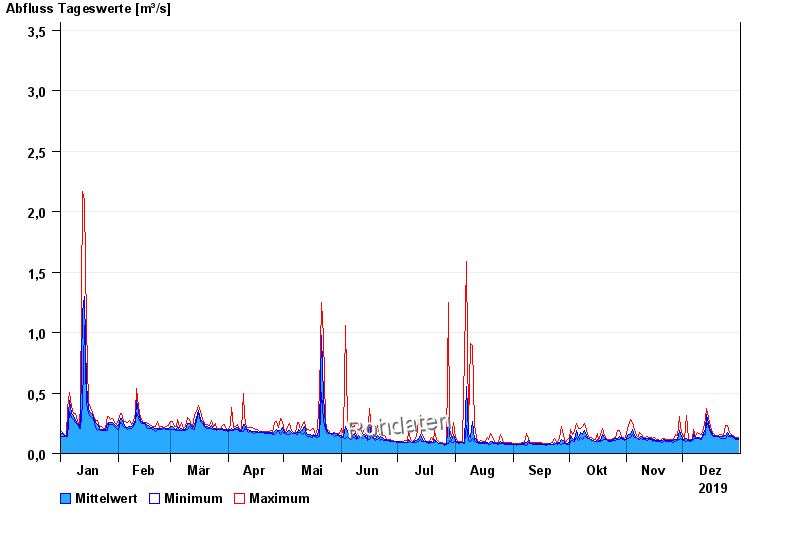
- Chart of year

Chart of year Lentersdorf / Bibert
Discharge from 01.01.2019 to 31.12.2019
- 12.03.1979 Abfluss: 16,4 m³/s
- 16.03.1988 Abfluss: 16,2 m³/s
- 13.04.1994 Abfluss: 14 m³/s
- 21.12.1993 Abfluss: 13,7 m³/s
- 09.03.2006 Abfluss: 12,2 m³/s
| Date | Mean value [m³/s] | Maximum [m³/s] | Minimum [m³/s] |
|---|---|---|---|
| 31.12.2019 | 0.127 | 0.133 | 0.116 |
| 30.12.2019 | 0.127 | 0.133 | 0.115 |
| 29.12.2019 | 0.132 | 0.139 | 0.127 |
| 28.12.2019 | 0.138 | 0.145 | 0.133 |
| 27.12.2019 | 0.146 | 0.158 | 0.139 |
| 26.12.2019 | 0.149 | 0.173 | 0.139 |
| 25.12.2019 | 0.173 | 0.23 | 0.145 |
© Bayerisches Landesamt für Umwelt 2024