
- Start >
- Rivers >
- Discharge >
- Unterer Main >
- Lentersdorf >
- Chart of year

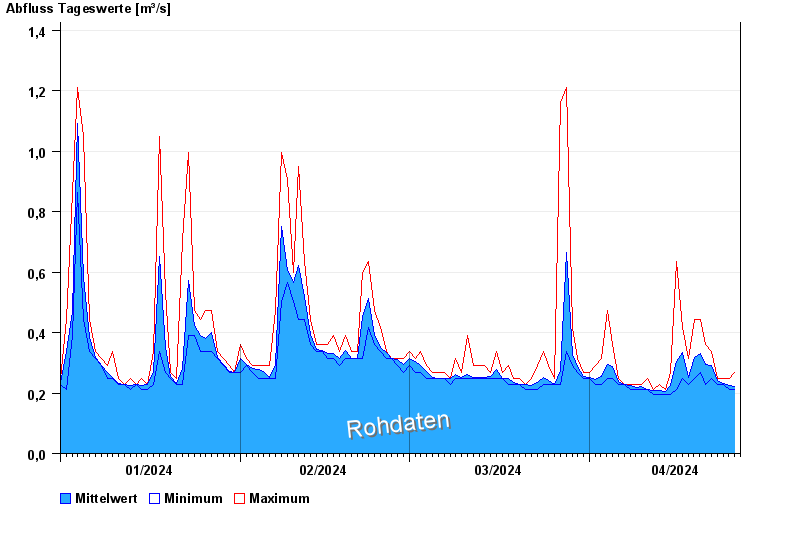
Chart of year Lentersdorf / Bibert
Discharge from 01.01.2024 to 26.04.2024
- 12.03.1979 Abfluss: 16,4 m³/s
- 16.03.1988 Abfluss: 16,2 m³/s
- 13.04.1994 Abfluss: 14 m³/s
- 21.12.1993 Abfluss: 13,7 m³/s
- 09.03.2006 Abfluss: 12,2 m³/s
| Date | Mean value [m³/s] | Maximum [m³/s] | Minimum [m³/s] |
|---|---|---|---|
| 26.04.2024 | 0.221 | 0.268 | 0.211 |
| 25.04.2024 | 0.225 | 0.248 | 0.211 |
| 24.04.2024 | 0.232 | 0.248 | 0.229 |
| 23.04.2024 | 0.24 | 0.248 | 0.229 |
| 22.04.2024 | 0.29 | 0.337 | 0.248 |
| 21.04.2024 | 0.294 | 0.362 | 0.229 |
| 20.04.2024 | 0.332 | 0.444 | 0.268 |
© Bayerisches Landesamt für Umwelt 2024