
- Start >
- Rivers >
- Discharge >
- Unterer Main >
- Lentersdorf >
- Chart of year

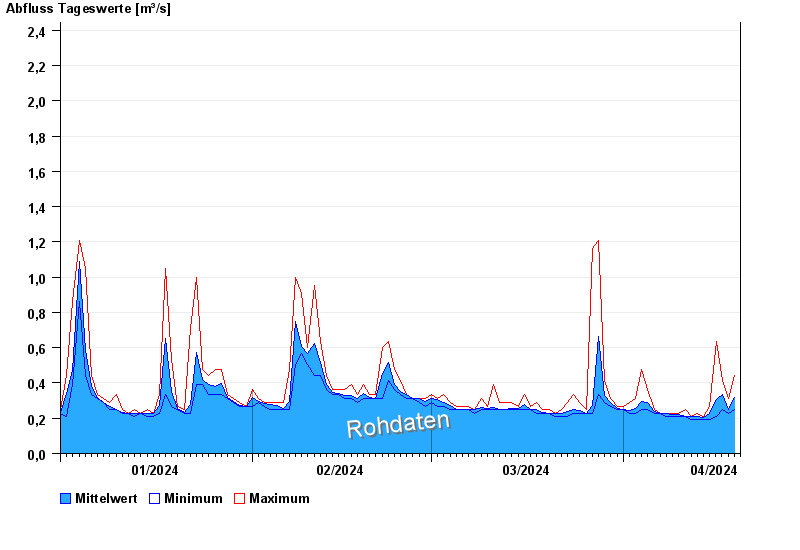
Chart of year Lentersdorf / Bibert
Discharge from 01.01.2024 to 19.04.2024
- HQ1 4 m³/s
- HQ2 6 m³/s
- HQ5 8,72 m³/s
- HQ10 11,8 m³/s
- HQ20 15,2 m³/s
- HQ50 20,8 m³/s
- HQ100 25,6 m³/s
| Date | Mean value [m³/s] | Maximum [m³/s] | Minimum [m³/s] |
|---|---|---|---|
| 19.04.2024 | 0.267 | 0.389 | 0.248 |
| 18.04.2024 | 0.25 | 0.313 | 0.229 |
| 17.04.2024 | 0.333 | 0.416 | 0.248 |
| 16.04.2024 | 0.304 | 0.634 | 0.211 |
| 15.04.2024 | 0.226 | 0.268 | 0.194 |
| 14.04.2024 | 0.205 | 0.211 | 0.194 |
| 13.04.2024 | 0.208 | 0.229 | 0.194 |
© Bayerisches Landesamt für Umwelt 2024