
- Start >
- Rivers >
- Discharge >
- Unterer Main >
- Hafenlohr >
- Chart of year

Chart of year Hafenlohr / Hafenlohr
Discharge from 18.01.2021 to 17.01.2022
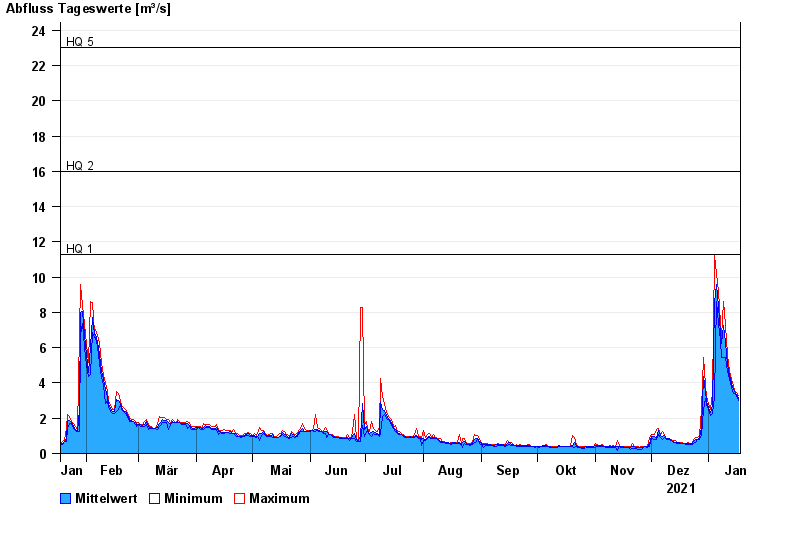
- HQ1 11,3 m³/s
- HQ2 16 m³/s
- HQ5 23 m³/s
- HQ10 28 m³/s
- HQ20 33 m³/s
- HQ50 40 m³/s
- HQ100 45 m³/s
| Date | Mean value [m³/s] | Maximum [m³/s] | Minimum [m³/s] |
|---|---|---|---|
| 17.01.2022 | 2.81 | 2.98 | 2.73 |
| 16.01.2022 | 3.03 | 3.1 | 2.98 |
| 15.01.2022 | 3.15 | 3.23 | 3.1 |
| 14.01.2022 | 3.3 | 3.48 | 3.1 |
| 13.01.2022 | 3.59 | 3.76 | 3.36 |
| 12.01.2022 | 4.01 | 4.18 | 3.76 |
| 11.01.2022 | 4.58 | 5.08 | 4.18 |
© Bayerisches Landesamt für Umwelt 2024